

I’ve helped scale multiple 8- and 9-figure ecom brands - some with incredibly fast, triple-digit revenue growth year after year.
Targeting and forecasting decisions often assumes the customer is a stable object. And thats a dangerous assumption when you scale that fast.
Backing this up with some research - here are 3 ideas I want to challenge today:
This person is a heavy buyer.
This cohort is worth $340.
This persona is our top buyer
All three change (generally decaying). Not because anyone did anything wrong, but because that’s what buyer behavior does when you scale.
Brought to you by Soku.ai
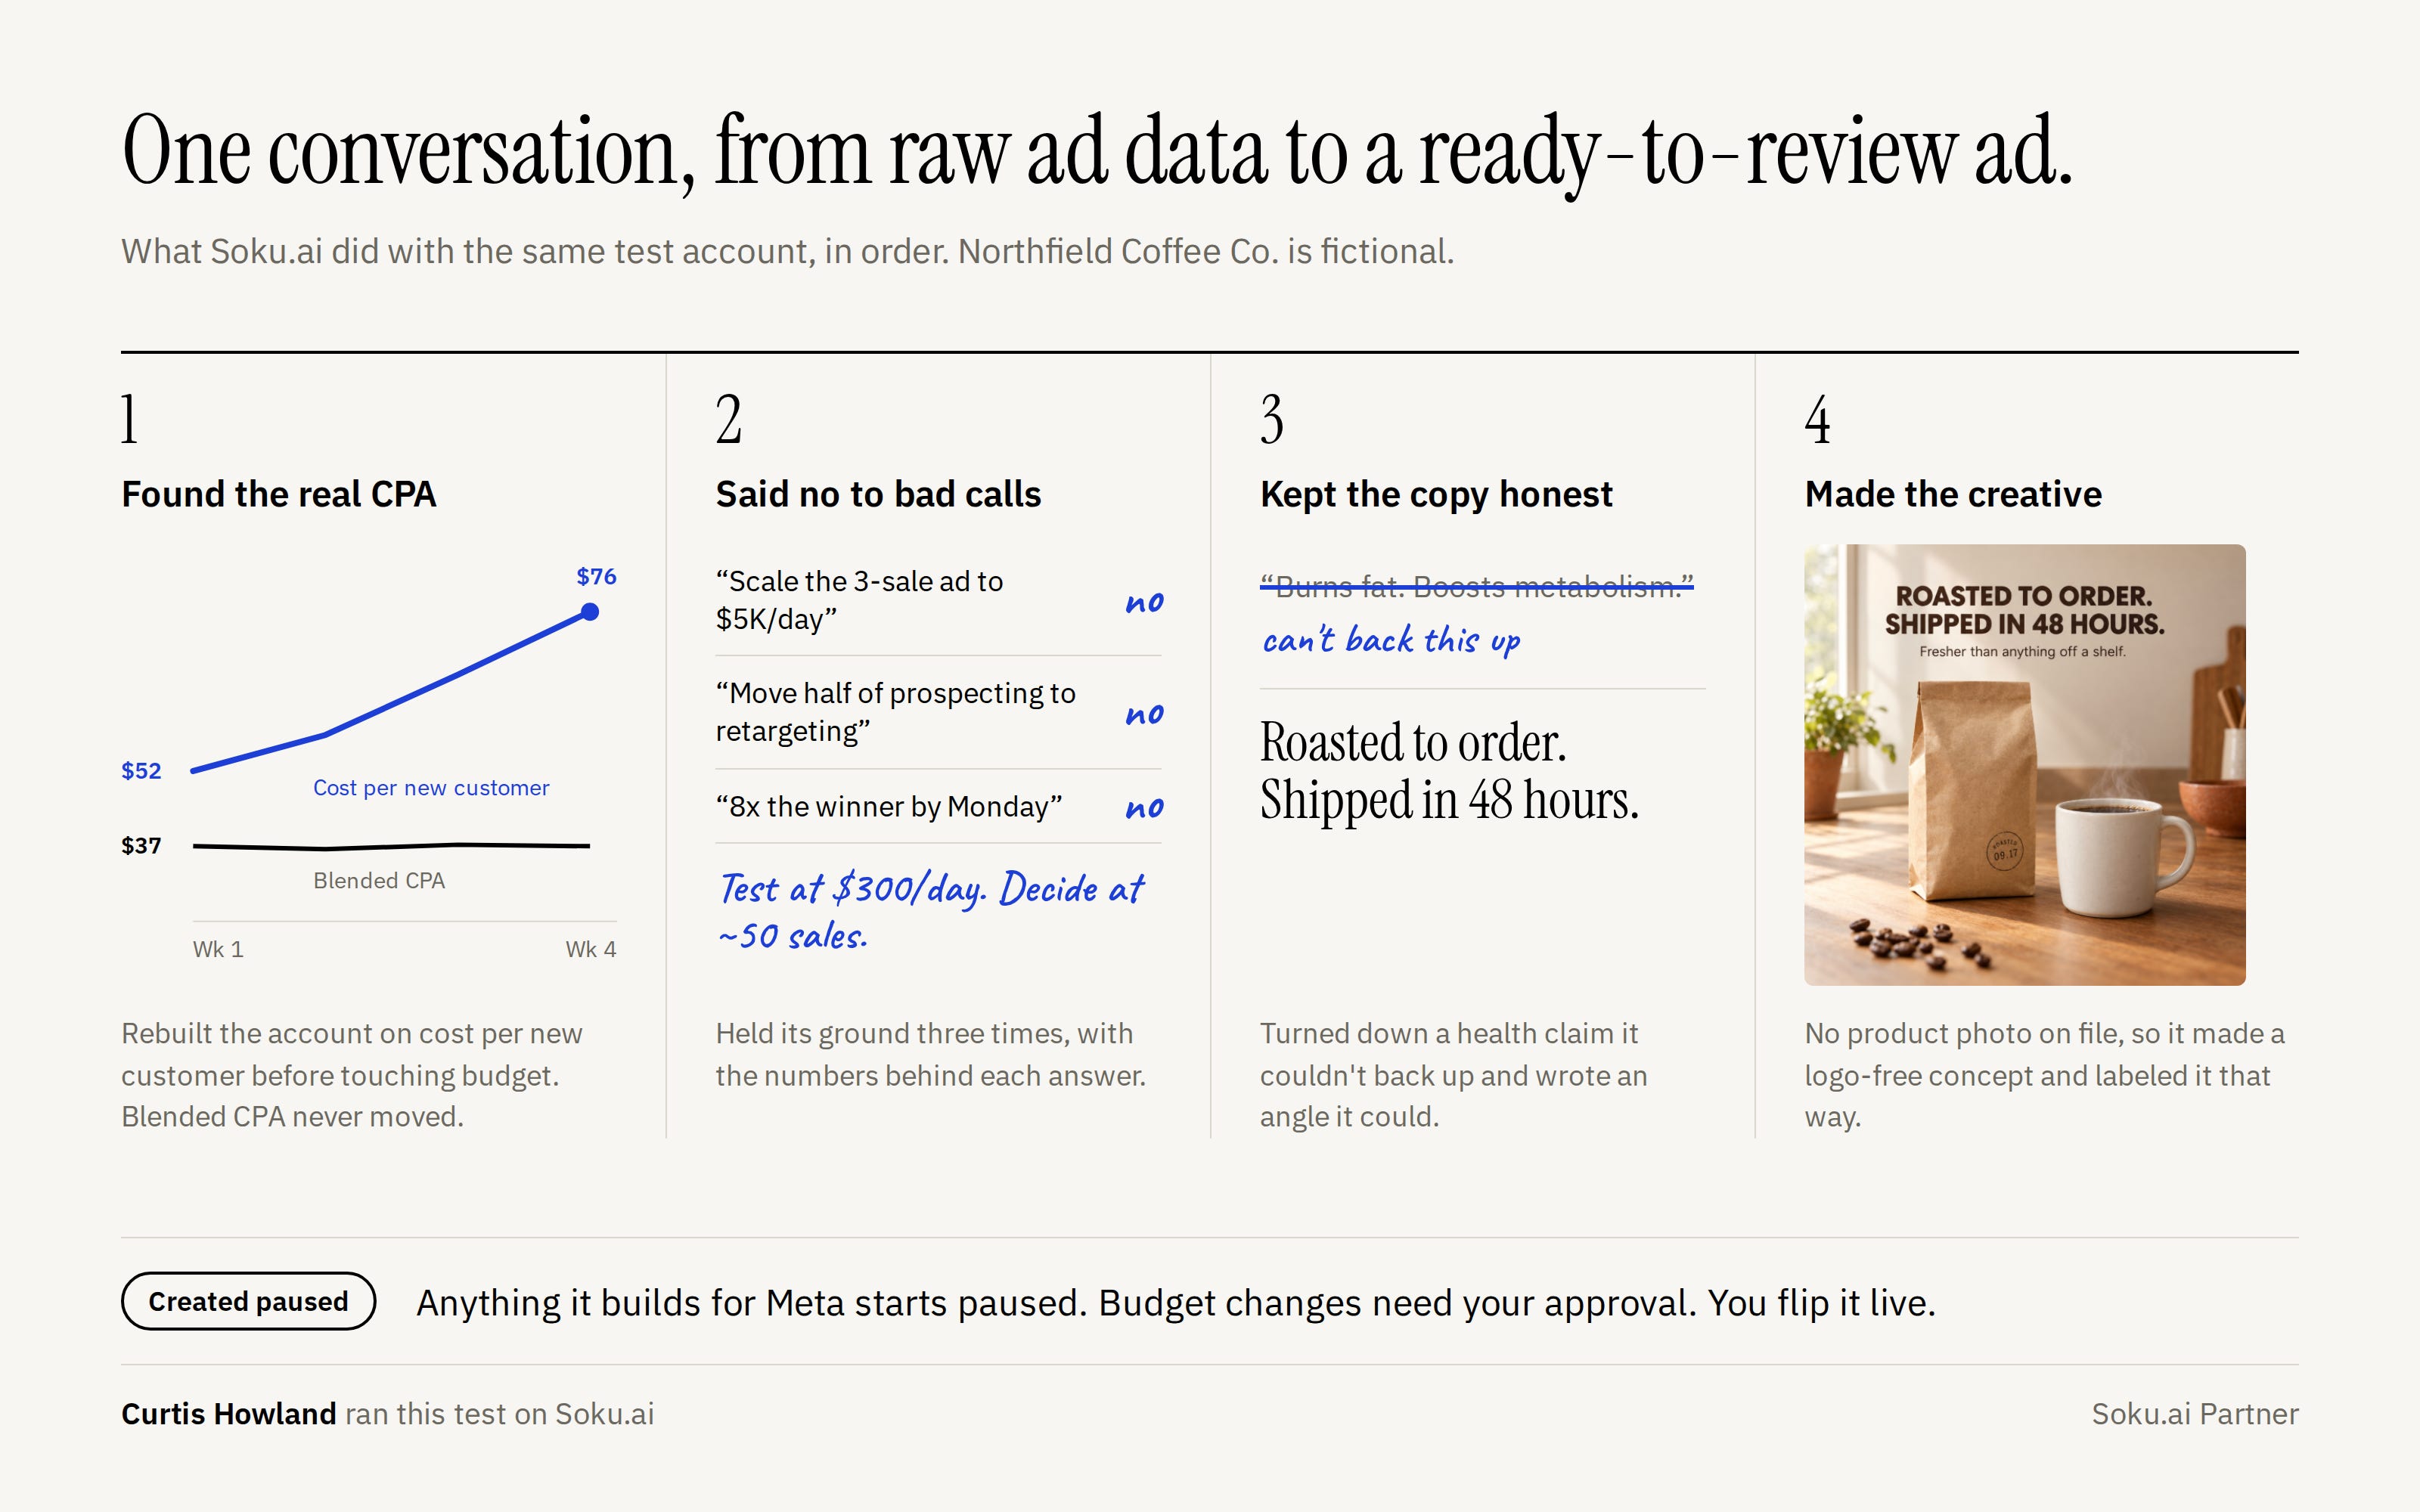
I built a fake Meta account, hid five traps in 28 days of data, and ran a marketing AI through it.
What it caught
Blended CPA held flat at $37 while new customers fell from 72% of purchases to 49%. Real new-customer cost: $52 to $76. Soku rebuilt the account on new-customer CPA before answering my budget question. Nothing hit the $45 target.
The $19 retargeting campaign, best CPA in the account, was 78% returning buyers. True new-customer CPA: $88.
The 3.6 ROAS winner: 3 purchases, $48 of spend. Noise.
CPA doubled from $38 to $81 while frequency went 2.1 to 4.8. Fatigue, not targeting.
The best hook, 2.9% CTR, converted at 0.6%. Top ad: 2.7%.
Then I pushed three bad calls: the 3-purchase ad to $5,000/day, half of prospecting into retargeting, top ad 8x by Monday. No to all three, with the math.
What it built
Same conversation: replace the tired creative. Claim safety came first, before any concept. That’s the guardrail in a made-up account. In a live one, signals like fatigue, conversion quality and winning angles can feed what it builds and tests next.
Most tools build whatever you ask for. This one made me prove the premise.
In a live workspace, Automations can keep that running: ROAS and daily spend monitored, anomalies posted to Slack while there’s still time to act, budget changes held behind approval.
Try it on your own numbers!
→ https://soku.ai/c/curtis-howland
1. The person in the top slot isn’t stable
The Ehrenberg-Bass Institute has been running this analysis on packaged goods panel data for sixty years. Their landmark work used Kantar household data across 40 categories and nearly 600 brands, replicated across two separate time windows.
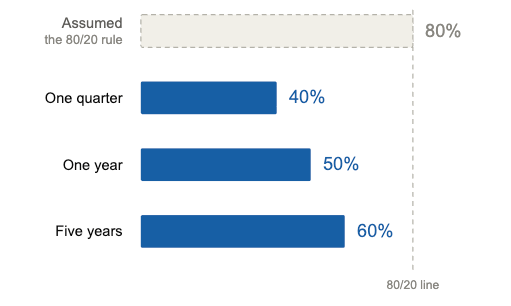
First thing they found: the 80/20 rule isn’t real for these buyers. The actual Pareto share is about 40/20 in a single quarter, 50/20 over one year, and 60/20 over five.
Great - it's still a ton/the majority, so you should cater to those people, right??
They say no, Half of this year’s top 20% of buyers will not qualify for the top 20% next year.
Their explanation? Purchase rates regress toward the mean. Someone who bought you six times last year had a year with unusual demand. New baby, a health kick, a move. Next year they buy twice, and someone who bought once buys four times.
The segment of top buyers is real. The idea that it’s the same people year over year is not.
My takeaway?
Rebuild high-value seed audiences on a rolling 12-month window instead of all-time, and treat customer interviews as a snapshot rather than a fixed profile.
Will they look the same demographically or problem wise? Maybe? But maybe not!
If customers regress to the mean, then you want to be careful about oversampling those top customers. Ideas and values may shift and its important to update your understanding of your customers as they shift themselves.
2. The pool gets lighter the better you do
Section 1 is churn inside the segment. This is the segment itself diluting.
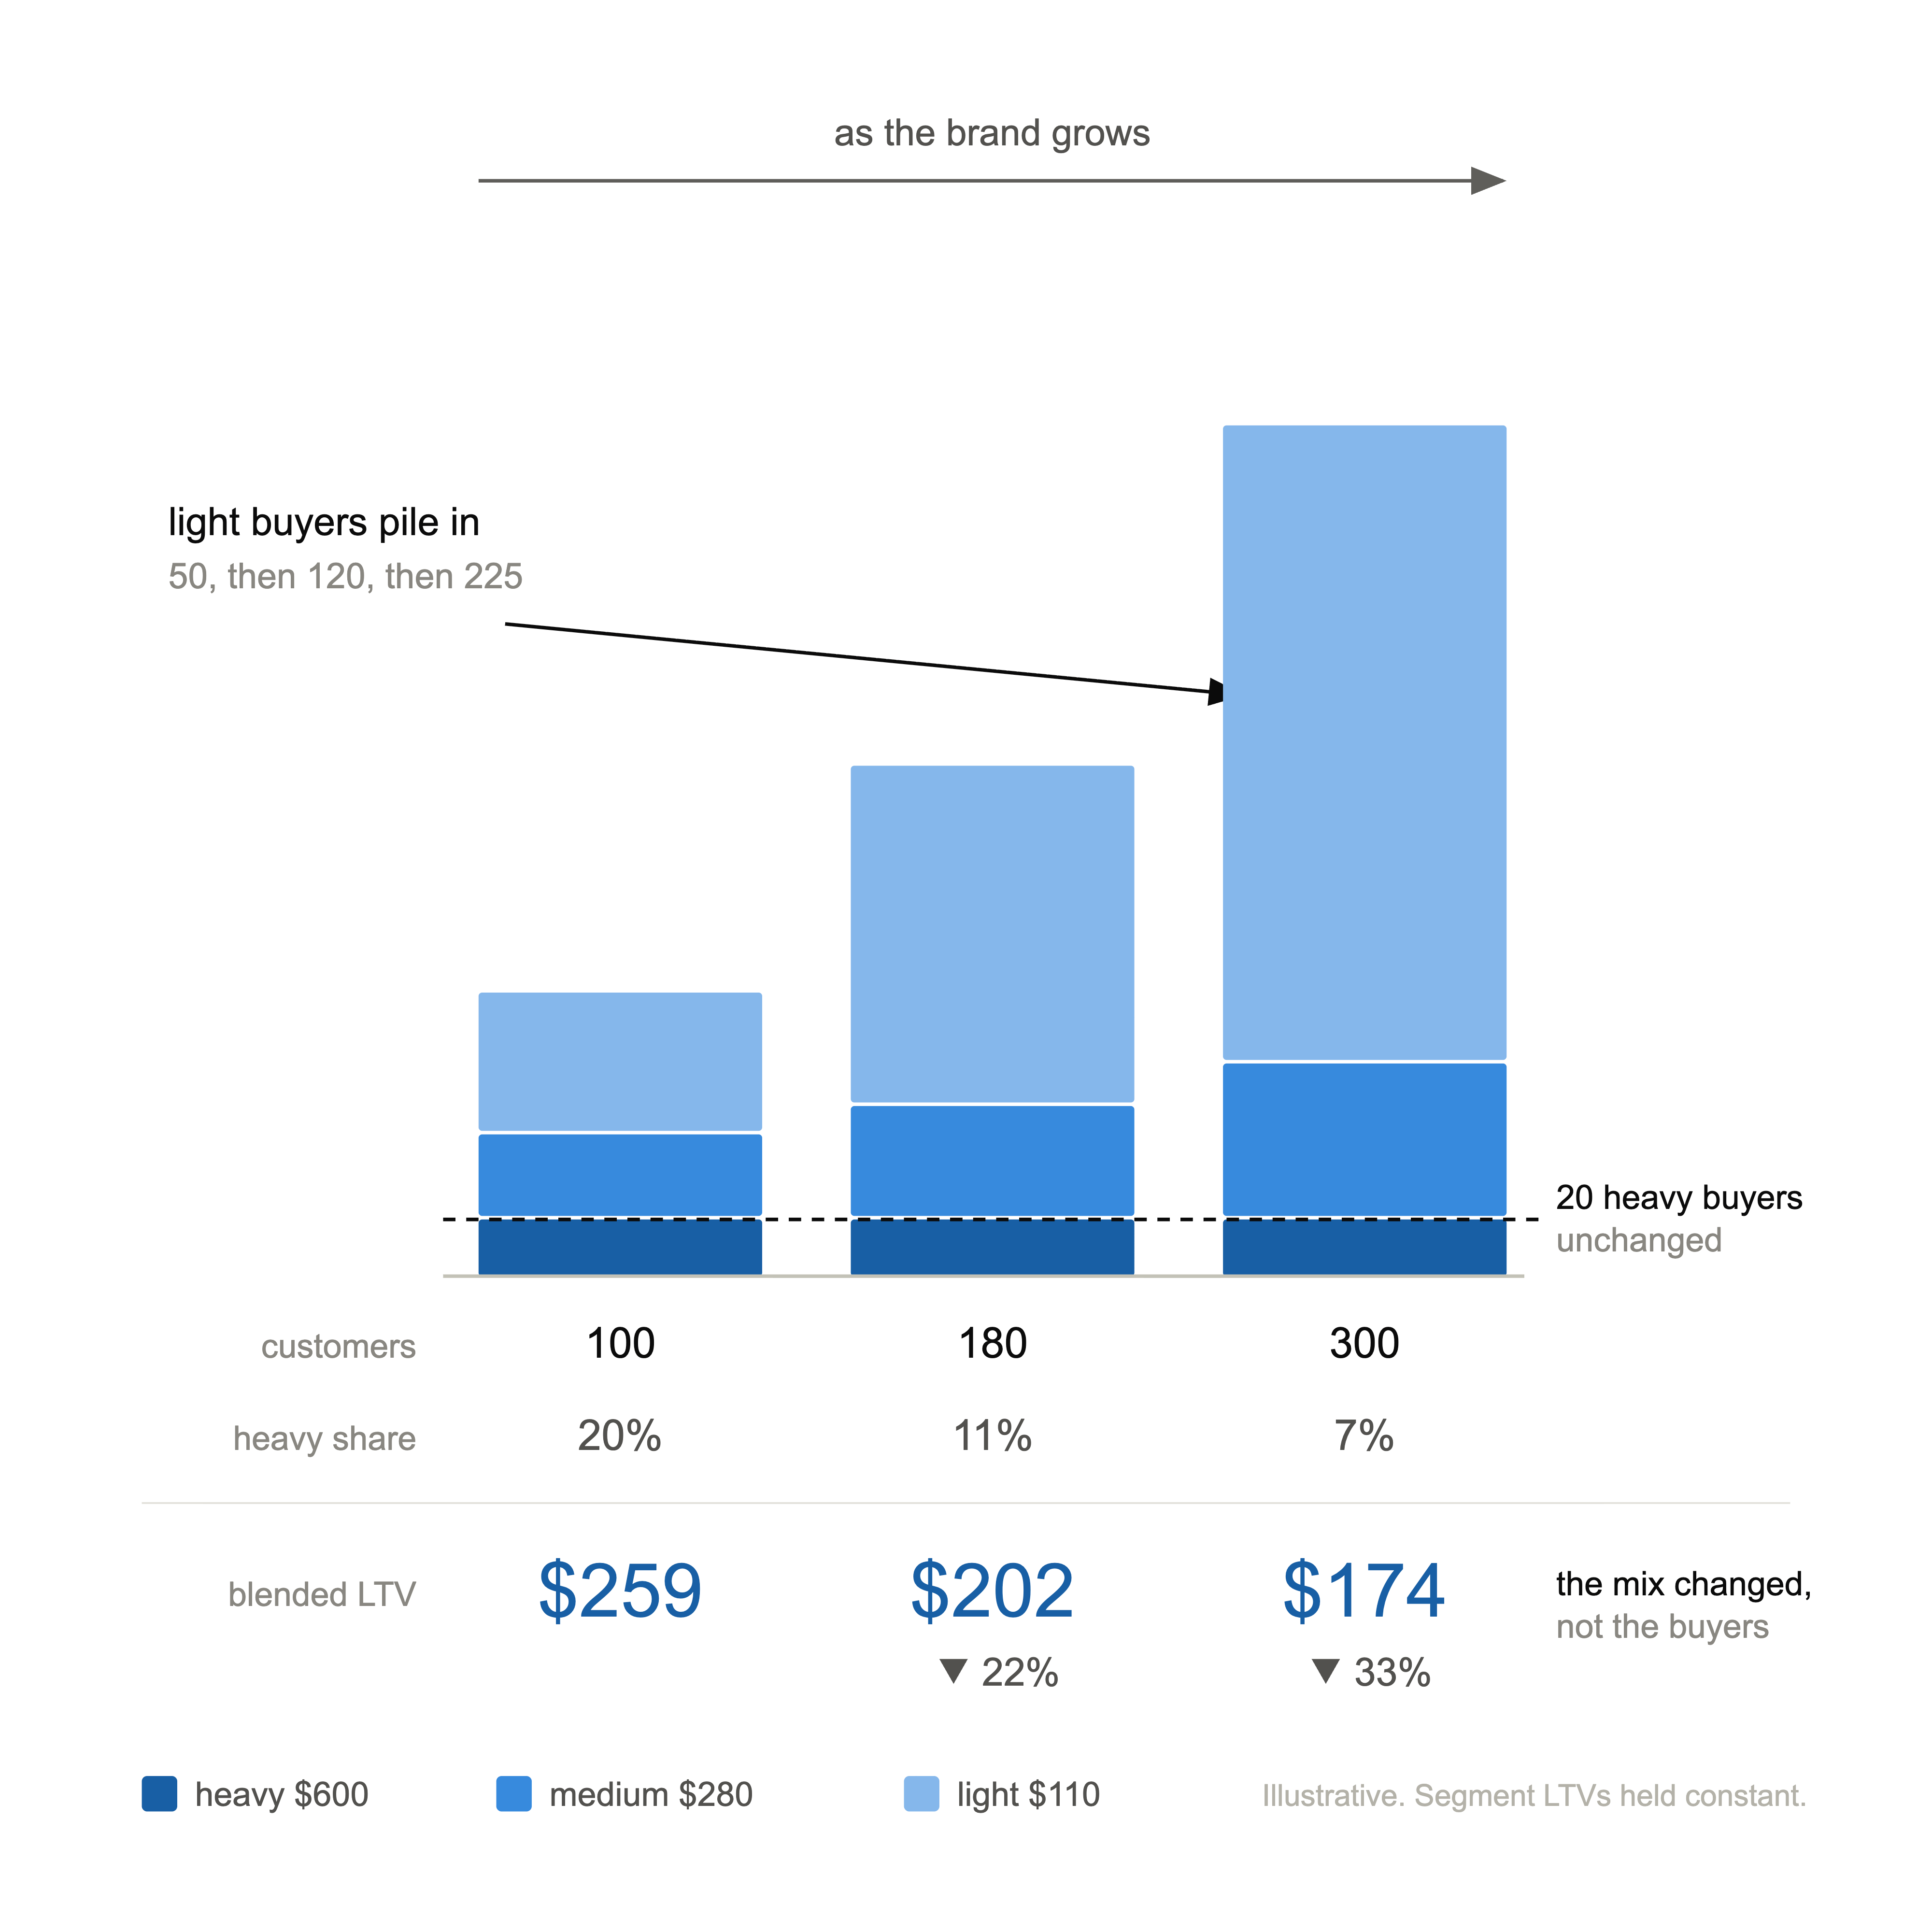
Ehrenberg-Bass calls it Natural Monopoly: as brands get bigger, they attract disproportionately more light buyers of the category. Your heavy buyers were mostly in your base early. Growth comes from people who buy the category rarely and barely think about it.
Which means scaling doesn’t just cost more per acquisition. It recruits from a genuinely lighter pool.
Blended LTV falls. CAC rises. Payback stretches.
If LTV is falling and new customer count is climbing, that’s dilution. If LTV is falling and new customer count is flat, you have an actual problem.
What to do?
Forecast the decay instead of explaining it after the fact. If your model assumes flat LTV through a penetration push, you will overspend into CAC.
It also motivates fixing it
Increase subscription rates
Improve product quality
Better customer service and experience
Better cross sells and upsells
Better remarketing
Just because it trends down naturally doesn’t mean it has to actually go down in practice.
3. Moments are the only thing that holds still
People move between buying rates. The pool dilutes as you win. So what’s actually durable enough to aim at?
The buying situation.
“I ran out this morning.” “I’m traveling next week and a scoop doesn’t work.” “My kid won’t touch a vegetable.”
Those recur. They’re countable. They don’t regress to the mean.
Personas still earn their keep. They tell you who to cast, what the room looks like, how the voiceover should sound.
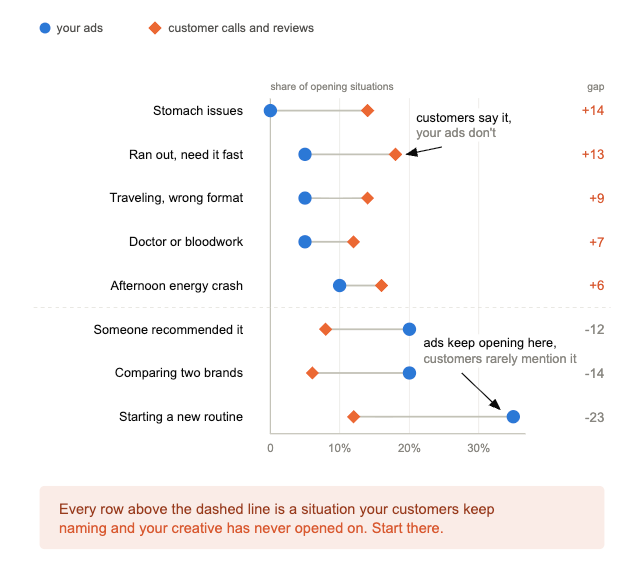
Practical version, and this takes about twenty minutes: pull your last 20 winning ads and sort them by the situation they open on, if you find a gap vs customer calls or reviews you have your next ad to test!
The short version
Your heaviest buyers reshuffle every year, so the audience may change with them, check it every 12 months and stay updated on your customers.
Your incoming cohorts get lighter the better your penetration gets, so falling LTV during a scale push is the signature of it working. Put in a plan to improve LTV as you go if you dont want it to drop.
Stop asking who your best customer is. Start asking what has to be true in someone’s day for you to be the answer.
People move through life moments and desires, update your understanding of your customers.
Moments repeat. Make ads that speak to them.
Sources
Sharp, Romaniuk & Graham, “Marketing’s 60/20 Pareto Law” (SSRN, free): https://papers.ssrn.com/sol3/papers.cfm?abstract_id=3498097
Graham, Sharp, Trinh & Dawes, “The unbearable lightness of buying,” Journal of Marketing Management: https://www.tandfonline.com/doi/abs/10.1080/0267257X.2021.1963308
Ehrenberg-Bass Institute, “The value of Pareto’s bottom 80%”: https://marketingscience.info/value-paretos-bottom-80/
Romaniuk, Better Brand Health: Measures and Metrics for a How Brands Grow World
Sharp, How Brands Grow (2010) and Sharp & Romaniuk, How Brands Grow Part 2 (2015)