

The thing that separates the brands scaling profitably from the ones stuck in a cycle of “we need better ads” is almost never one thing. It’s 50 things working together.
Most brands have 60-70% of the basics covered. This list is to fill in the gaps.
So I built this. One checklist. Everything an ecom brand needs to have in place before trying to scale, organized by category.
This isn’t a deep dive on any single topic. Just a place to start.
1. Unit Economics
If you don’t know your numbers at the individual customer level, nothing else on this list matters. You can’t scale what you can’t measure.
☐ You have a 1st Customer P&L. Not blended. Just first-time orders. Revenue minus COGS, shipping, payment processing, and acquisition cost. This is the number that tells you if growth is actually profitable.
(Read this substack to grab a template)
☐ You know your nCAC ceiling. The maximum you can pay to acquire a new customer and still hit your contribution margin target. If you don’t have this number, your media buyer is flying blind.
☐ You track LTV by acquisition channel. Meta customers behave differently than Google customers. TikTok Shop customers behave differently than both. If you’re using blended LTV, you’re probably overpaying on at least one channel.
☐ You know your contribution margin by customer cohort. Not just overall. By month of acquisition, by channel, by offer. The brands that scale fastest can tell you exactly which cohorts are profitable and which aren’t.
☐ You can forecast revenue from ad spend with 80%+ accuracy. If you can’t, you don’t have enough data or your attribution is broken. Either way, fix it before you scale.
☐ You know your payback period. How many days until a new customer becomes profitable after acquisition cost. If it’s 90+ days, you need to plan cash flow around it, not ignore it.
2. Creative Production
Creative is the single biggest variable in paid media performance. Make it a system that focuses on quality & quantity at the right levels.
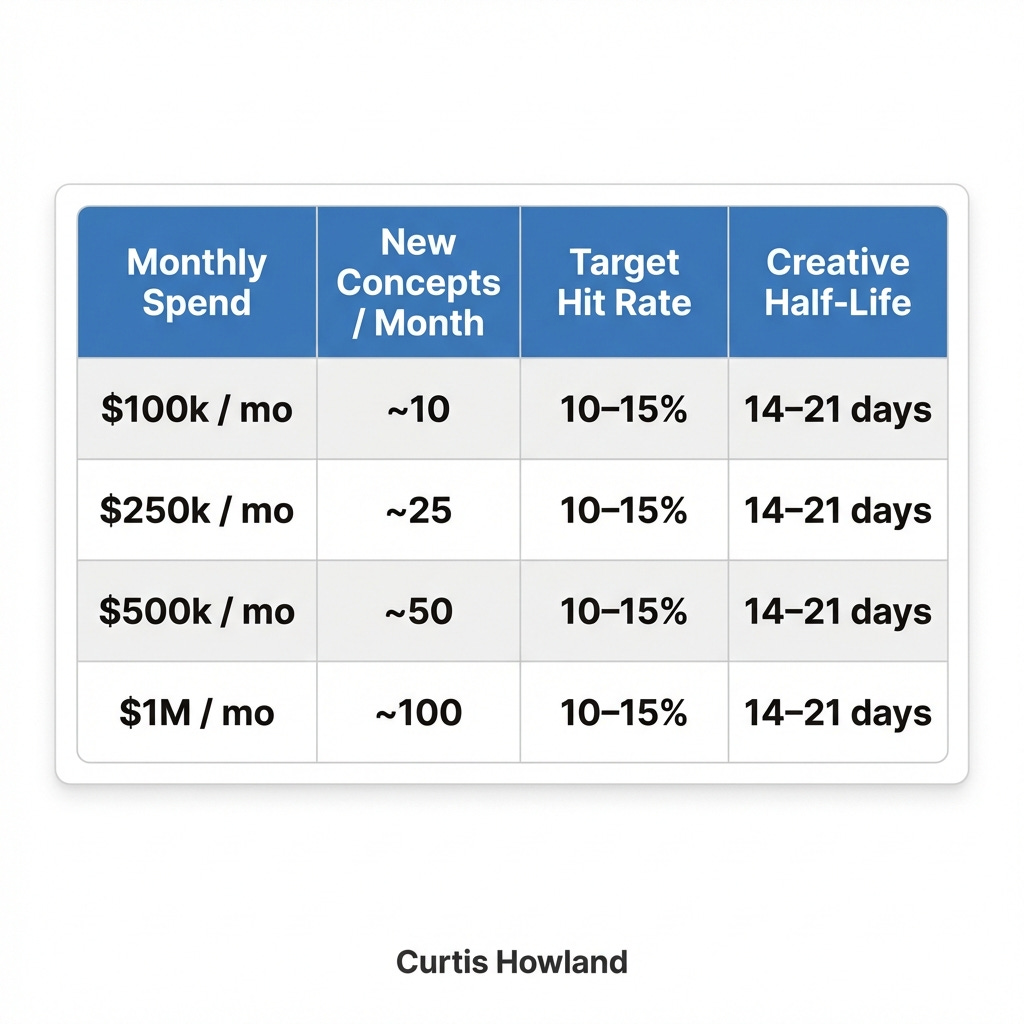
☐ You’re launching ~1 new concept per $10k in monthly ad spend. At $500k/mo, that’s roughly 50 new concepts. (3 ads per concept, not too similar!) Scaling hard? Launch pre-emtively (project budgets and product for that). Ads fatigue quickly? Produce even more. (Don’t go above 1 ad per $1k (1 concept per $3k) in spend, though, unless you have a tiny AOV like Temu).
☐ You track creative hit rate. What percentage of new ads meet your CPA or ROAS target? Aim for 10-15%. Below 5% means your concepts are off. Above 25% means you’re probably not testing enough variety or scaling the right ones.
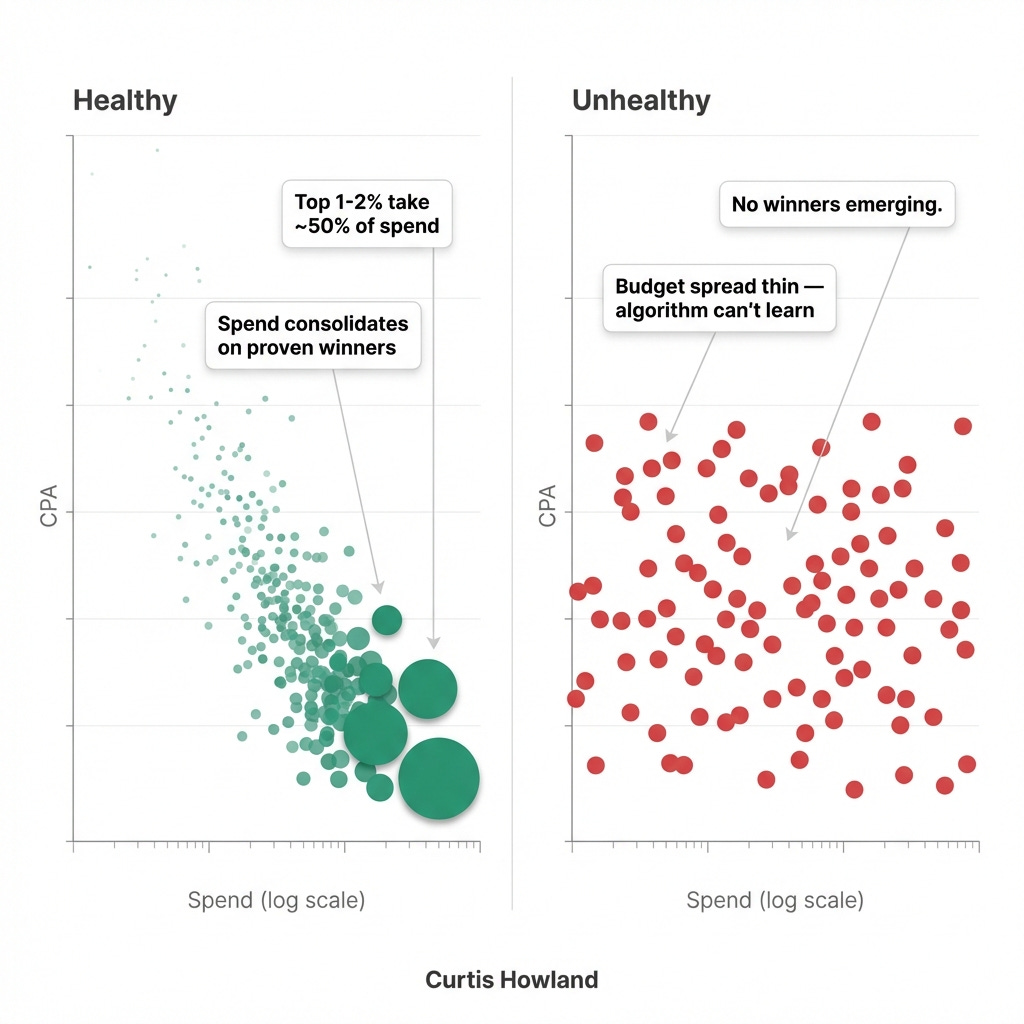
☐ You have a scatter plot of every ad. CPA on Y axis, spend on X axis (log scale). Look for a pattern of ads being scaled within confidence levels.
☐ You know your creative decays. How much does your ad account decay every month if you don’t add new ads? This tells you how fast you need to produce beyond general benchmarks.
☐ You track spend-weighted creative age. Weight each ad’s age by its share of total spend. If that number is climbing, your portfolio is aging and performance will follow.
☐ You’re not trying to over learn from losing ads. I’ve launched 20,000+ ads. Analyzing losers to learn what not to do can lead you in the wrong direction. If you want to learn from ads, focus on huge hits and aggregate learnings (you can aggregate losses to get statistical significance). If you want to improve ads, then take a winner from 2x ROAS to 3x instead of trying to save a 0.5x.
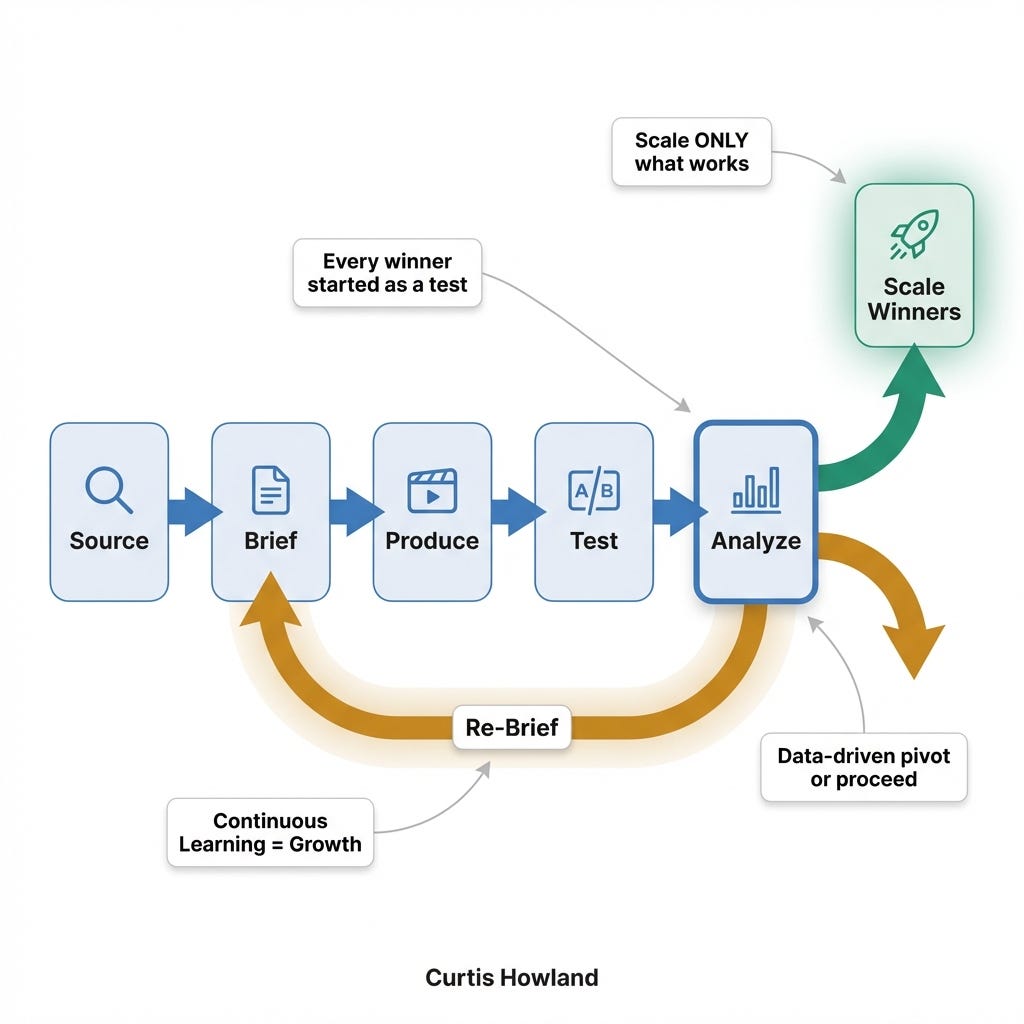
☐ You have a creative brief process. Not a Slack message that says “we need more ads.” A documented brief with the concept, angle, hook, target persona, and reference examples.
3. Media Buying
Good media buying is invisible. Bad media buying looks like a creative problem. Here’s how to tell the difference.
☐ Your top 1-2% of ads take ~40-60% of total spend. This is what a healthy power law looks like. If spend is spread evenly across ads, the algorithm isn’t finding winners (or your buyer isn’t letting it). Please note, the top creatives should not look identical and should not be promotions. Diverse problem aware ads at the top please!
☐ You have a kill rule. Example: at $250 spend, cut if CPA is 2.4x target. At $1,000, cut at 1.4x. At $5,000, cut at 1.15x. Use confidence intervals, not gut feel.
☐ You’re not testing faster than Meta can learn. Count new ads launched in the last 30 days. Check spend per ad. If you’re spreading $500k across 1000 new ads, none of them have enough data to read. Cut so many variations, focus on quality, and balance testing and scaling.
☐ You use both cost cap and highest volume. Cost cap for scaling volatile ads that have winning potential. Highest volume for testing new concepts that need room to find their audience.
Some accounts do best with all cost cap, some with all ABO. Most can benefit from both. Test everything Meta has for you and evaluate.
☐ Your account structure matches your spend level. Under $100k/mo, keep it simple (1-2 campaigns). Over $500k/mo, you probably need segmentation by LTV / Product / Margin etc. Whatever Meta can’t differentiate well or the business needs to dictate more than absolute performance.
☐ You’re day-trading budgets on winners. Green day (CPA in target)? Increase spend. Red day? Pull back. Your best ads should be getting more gas every day they perform, not waiting for a weekly review. Don’t make the mistake of the occasional huge swing. Small gentle nudges gives the algo good feedback.
Bonus: Use intra-day pacing, not just yesterdays data.
☐ You check the change log. Pull the last 90 days of changes from Ads Manager. You should know who is making changes in your account, is it 1 person or 10? Do you know who they are? Is it all automated? Common questions you can answer quickly by checking.
4. Attribution
If your attribution is wrong, every decision downstream is wrong. This is the part most brands skip because it feels complicated.
Channel level allocation is so much more important than campaign allocation.
You might be optimizing $’s in the completely wrong ecosystem.
☐ You use multi-touch attribution (MTA). Platform-reported numbers are biased. An MTA tool (Triple Whale, Northbeam, Rockerbox, etc.) gives you a second opinion on which ads actually drove conversions.
☐ You run incrementality tests. Holdout tests, geo-lifts, or conversion lift studies. At least quarterly. This is the only way to know if your spend is actually causing revenue or just taking credit for it.
☐ You have a post-purchase survey. “How did you hear about us?” is the simplest attribution model and it catches things pixel-based models miss entirely (podcasts, word of mouth, organic social).
☐ Your three models roughly agree. MTA, incrementality, and survey. If all three say Meta is working, it’s working. If they disagree, dig in before you scale. Trust non click based attribution first. Don’t over optimize for last click.
☐ You’re not relying on last-click for Meta. Last-click undervalues Meta by 30-50% in most accounts. If you’re optimizing to last-click, you’re cutting winners.
☐ You track view-through conversions separately. Platforms love to claim view-through credit. Break it out and compare to click-through. If 50%+ of your attributed conversions are view-through, be skeptical.
Go deeper into this topic here:
8 Types of Attribution Every DTC Brand Should Know (And the 3 I Actually Use)

I manage millions in monthly Meta ad spend in the DTC space.
5. Landing Pages / CRO
You can have the best ads in the world. If your landing page doesn’t convert, you’re just paying to send people to a bad experience.
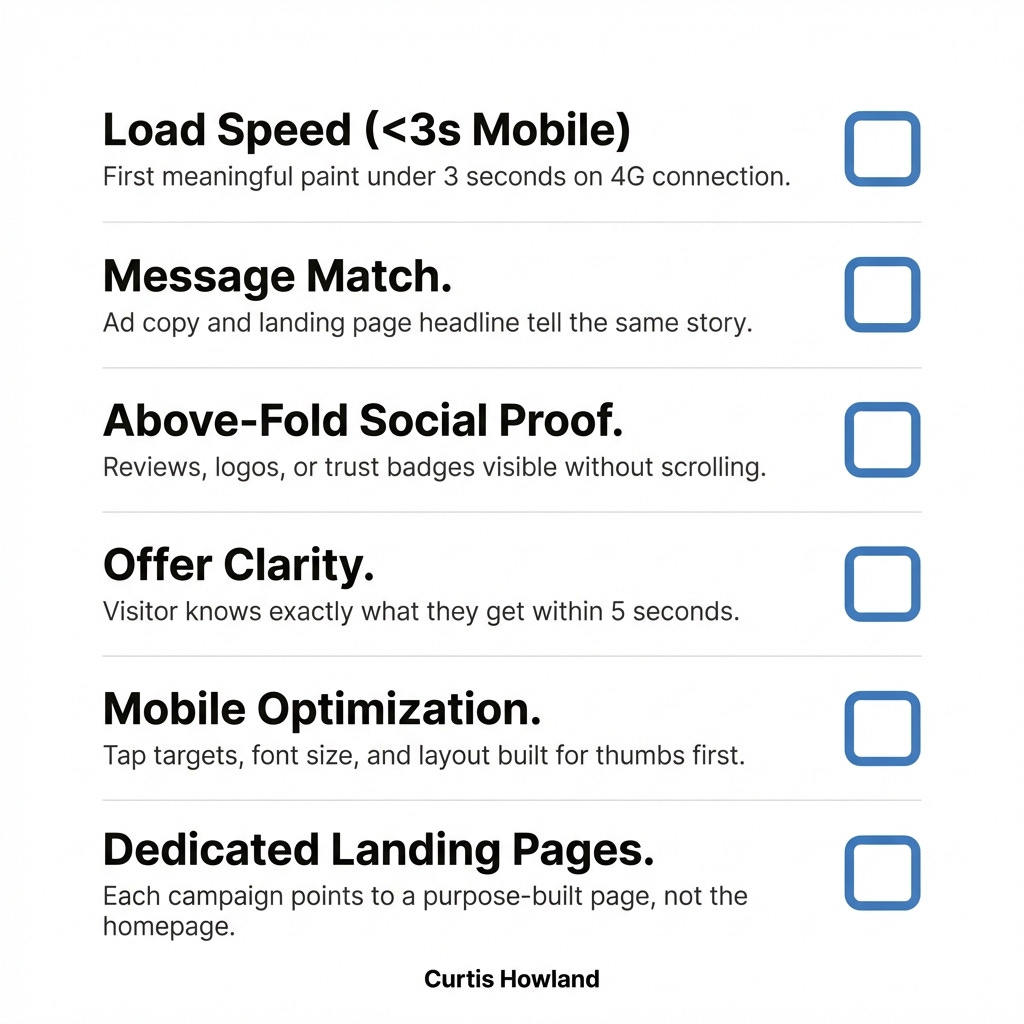
☐ You test dedicated landing pages for top ads. Not just your homepage. Your best-performing ad concepts should test pages that continue the same story, angle, and offer.
☐ Your page loads in under 3 seconds on mobile. Check it. Most brands think their site is fast. It’s not. Slow pages kill conversion rates and inflate CPAs.
Stop, test your top pages:
☐ You test landing pages, not just ads. A 20% lift in landing page conversion rate is worth the same as a 20% drop in CPA. Stacking 30 AB tests that improve CVR 1% means 35% improvement in ROAS (which could mean 2x the spend at your target ROAS).
☐ Your above-the-fold matches your ad. If the ad promises “50% off your first order” and the landing page headline says “Premium skincare for the modern woman,” you have a problem.
☐ You have social proof visible without scrolling. Reviews, star ratings, press logos, customer count. Something that says “other people already bought this and liked it.” Take the risk away for customers.
☐ You test your offer on the landing page, not just in ads. The offer is usually the highest-leverage variable. Free shipping vs. discount vs. bundle vs. gift with purchase. Test the page, not just the ad copy.
6. Channel Diversification
Meta is probably your primary channel. But try not to make it your only channel.
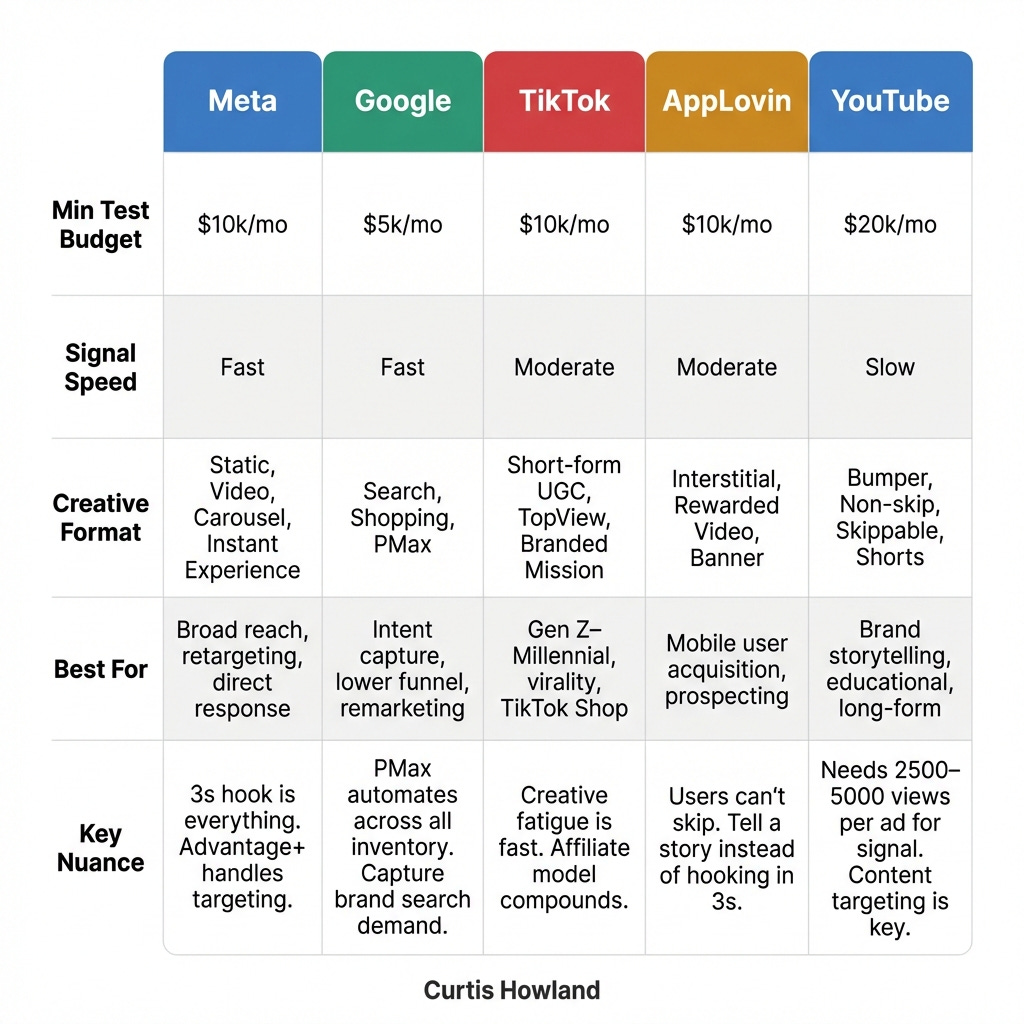
☐ You have a plan for at least one channel beyond Meta. Google, TikTok, AppLovin, YouTube, Pinterest. You don’t need to be on all of them. But you need at least one backup generating revenue is worth a bit of dilution. Don’t go too far and test all of them at once though. Get good at each channel.
☐ You understand the platform differences before copying ads over. Meta ads interrupt the scroll (3s hook is everything). AppLovin interstitial ads can’t be skipped for 15-30 seconds (tell a story instead). YouTube needs $2,500-5,000 for a reliable signal vs. $500 on Meta.
☐ You’re spending enough on each channel to learn. YouTube needs $15-25k/mo minimum to test properly. TikTok Shop needs volume. All channels need dedication. Don’t spread $20k and minimal focus across 4 channels and conclude “none of them work.”
☐ You’ve evaluated TikTok Shop as a creative subsidy. Even if it’s not profitable directly, high affiliate commissions can generate thousands of creator videos you can repurpose across Meta and YouTube.
☐ You’re not just reposting Meta ads on other platforms. Learn from all channels and test across all channels but the winners may not be the same.
☐ You have a Google brand search strategy. If you’re spending on Meta, you’re generating search demand. Make sure you’re capturing it, not losing it to competitors bidding on your brand name. But also PLEASE don’t just accept the CPC’s Google requests from you. Those customers are looking for you and Google knows its best to send them to you, bid less and they will accept it.
7. Offers & Pricing
Your offer is usually the single highest-leverage variable in your funnel. A mediocre ad with a great offer beats a great ad with no offer almost every time.
☐ You’ve tested at least 3 different offer structures. Percentage off, dollar off, free gift, bundle, free shipping, subscribe-and-save discount. Find the one that makes sense for you and ideally tie to a subscription.
☐ You know which offer converts best for new customers vs. returning. The offer that gets a first purchase is maybe not the same one that drives repeat.
☐ Your offer math works at your nCAC ceiling. A 40% discount that drives a ton of conversions but puts you underwater on first purchase is only viable if your LTV math supports it.
☐ You rotate offers seasonally. The same “20% off” gets stale. Most brands need rotation.
☐ You’ve tested a strong offer against no offer. Some brands (especially premium) convert better with no discount and strong value messaging. You won’t know until you test.
8. Creator & UGC Pipeline
Creator content is the fuel for paid media. But most brands treat it as a one-off transaction instead of a system.
☐ You have a repeatable creator sourcing process. Not “we post on a UGC platform when we need ads.” A system that consistently brings in new creators monthly.
☐ You track creator performance at the individual level. Some creators produce 3x ROAS content consistently. Others produce duds. If you’re not tracking this, you’re treating a 10x creator the same as a 0.5x creator.
Pull the best ones into a group and treat them like pseudo-employees.
☐ You have a mix of UGC styles. Talking head, unboxing, tutorial, lifestyle, street interview, testimonial. Different formats resonate with different audiences and fatigue at different rates. Diversity reduces fatigue across the whole account.
☐ You brief creators with winning angles, not scripts. Give them the hook, the angle, and the key proof points. Let them deliver it naturally. Over-scripted UGC performs like a bad infomercial.
☐ You’re repurposing top UGC across channels. Your best Meta UGC should be tested on TikTok, YouTube Shorts, and Pinterest. Most brands leave performance on the table by siloing content to one platform.
☐ You’ve considered a creator community model. Brands like Comfrt scaled to $1b with 1,000,000 TikTok affiliates. Even at a smaller scale, an affiliate/community model compounds in a way that one-off UGC doesn’t.
9. Retention / Email / SMS
Acquisition gets all the attention. Retention is where the margin lives.
☐ You have a post-purchase email flow. Not just a confirmation email. A sequence that educates, builds loyalty, and drives the second purchase.
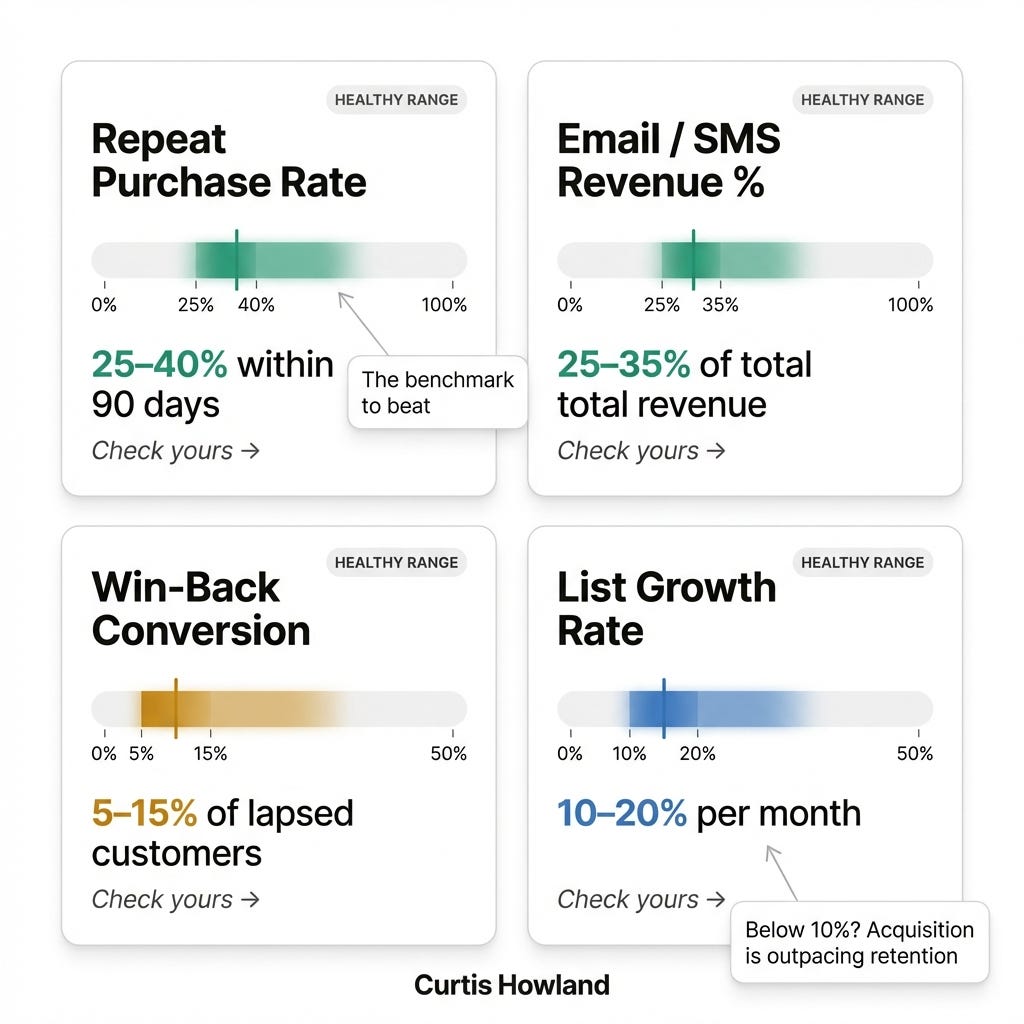
☐ You know your repeat purchase rate by cohort. What percentage of January customers buy again within 60 days? 90 days? If you don’t know this by cohort, you don’t really know your LTV.
☐ You have a win-back flow for lapsed customers. Customers who bought 90-180 days ago and haven’t returned. A targeted offer here is almost always cheaper than acquiring a new customer.
☐ Your email/SMS list is segmented beyond “everyone.” At minimum: new subscribers, first-time buyers, repeat buyers, VIPs, lapsed. Each segment should get different messaging.
☐ You’re not over-discounting to your existing list. If every email is a sale, you’re training customers to wait for discounts. Mix value content, new arrivals, and social proof into the cadence. Don’t Bed Bath and send your company to the Beyond. (Sorry I can’t help myself)
☐ You track revenue from email/SMS as a percentage of total. Healthy benchmark is 25-35% of total revenue from owned channels. Below 15% means your retention engine needs work.
10. Reporting & Dashboards
If your team can’t see the data, they can’t act on it. Reporting isn’t a nice-to-have. It’s the operating system.
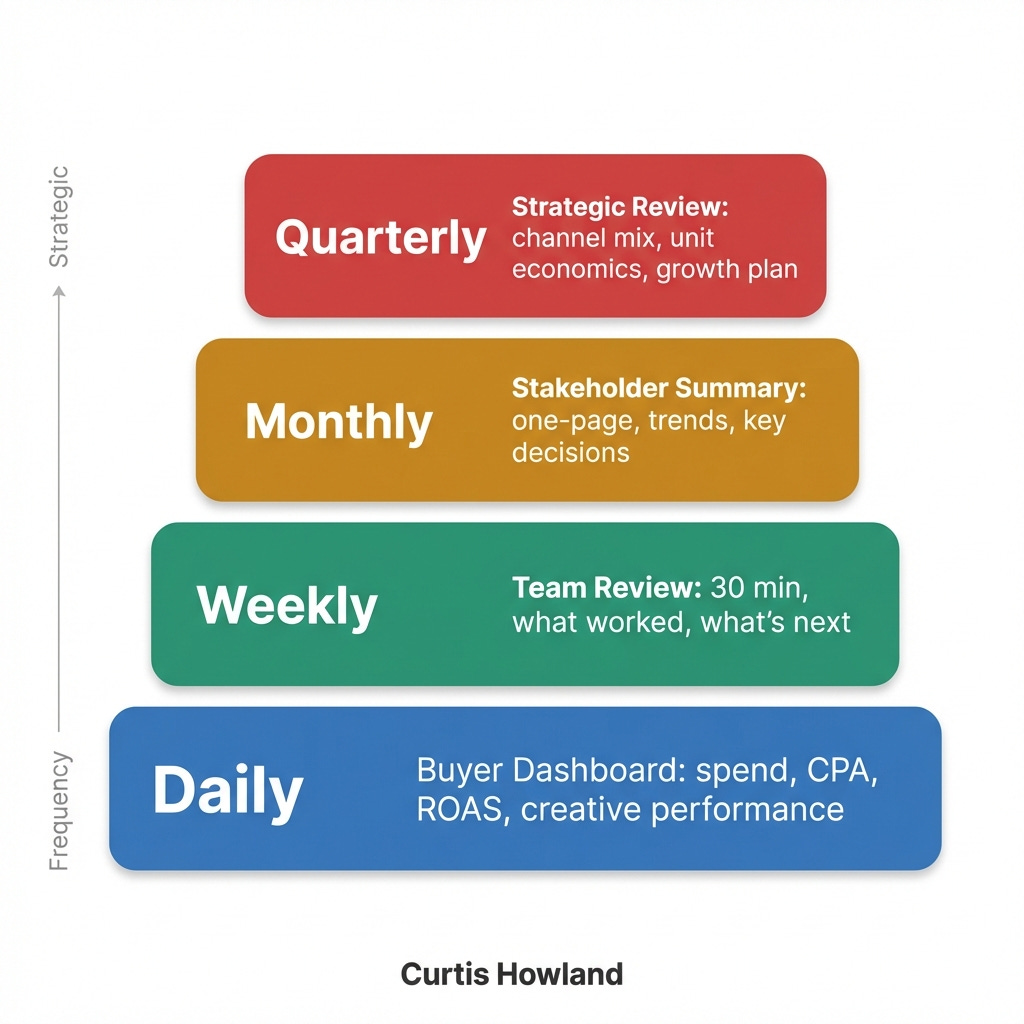
☐ You have a daily dashboard your buyer checks every morning. Spend, CPA, ROAS, and creative performance at a glance. If your buyer waits until Friday to check performance, you’re losing money Monday through Thursday.
☐ You track creative performance at the individual ad level. Not campaign level. Not ad set level. Individual ad. The scatter plot from Section 2 should be something your team builds weekly.
☐ You have a weekly reporting cadence with your team. 30 minutes max. What worked, what didn’t, what’s launching next week. No 45-slide decks. Just the numbers and the plan.
☐ Your reporting separates prospecting from retargeting. Blended ROAS hides the truth. A 4x blended ROAS could be a 2x on prospecting and 10x on retargeting. You need to see both.
☐ You track month-over-month trends, not just snapshots. A 3x ROAS this month means nothing without context. Is it up or down? Is CPA trending higher? Is creative fatigue accelerating? Trends tell the story.
☐ You share results with stakeholders who aren’t in the weeds. The founder, the CFO, the board. They need a one-page summary, not an Ads Manager export. Build it once and update it weekly.
How to use this
Count your checks. Figure out your biggest opportunities.
Don’t do everything at once, pick one high leverage change and keep improving your business!
Happy scaling!
Curtis