

I used to run Marketing at an e-commerce company; now I run ads for e-commerce brands.
No matter which seat I am in, knowing new-customer economics at a very detailed level is CRUCIAL.
Some brands split new and returning metrics out. But most don’t split far enough to really understand their economics.
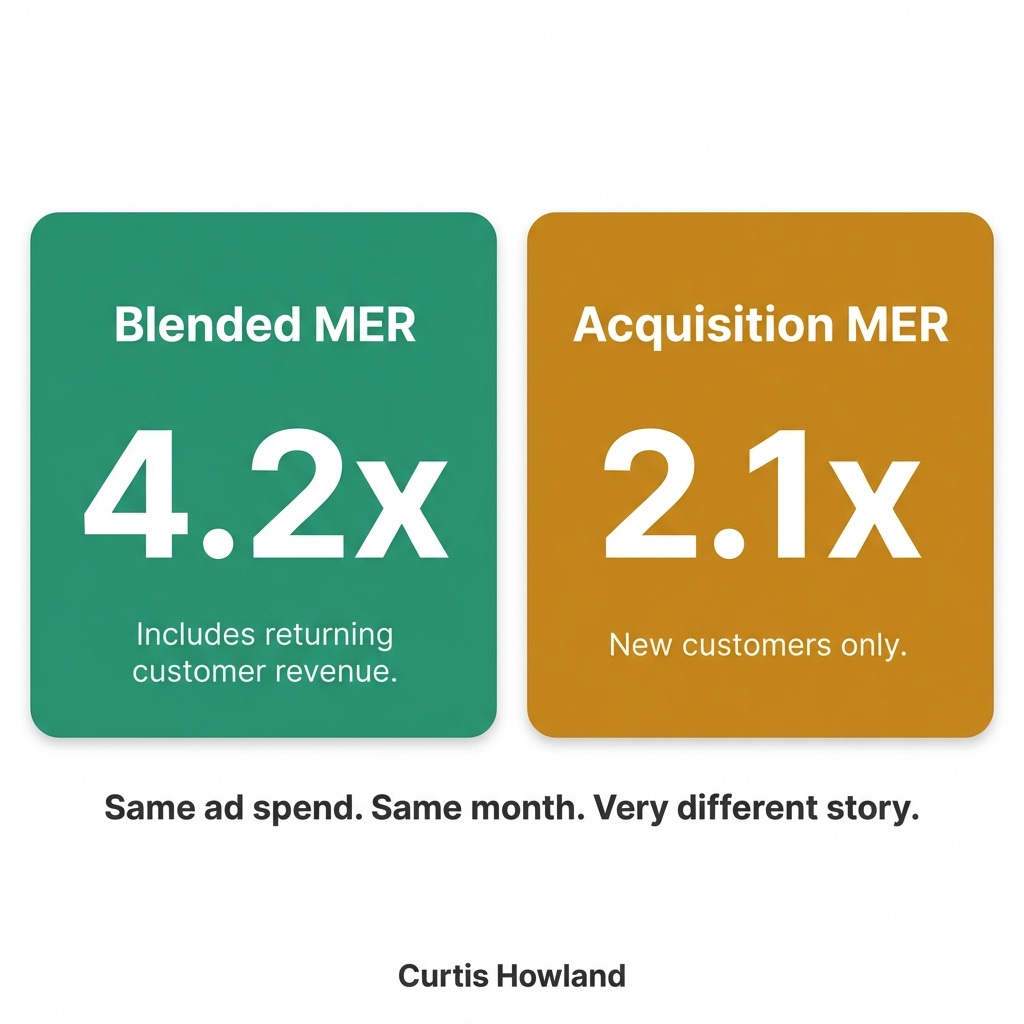
Too often, brands look at blended ROAS. Blended MER. Blended contribution margin. Maybe New Customer CPA, but then they use blended numbers to compare to it. And they make scaling decisions off numbers that are inflated by repeat buyers who would have purchased anyway.
During a strong season? Maybe you scale into new customers profitably but MER goes up so you pull back. Off-season? You see strong blended MER (lots of returning / minimal new), and you overspend.
Bad data means you scale at the wrong times and cut at the wrong times. And your business grows slower than it needs to.
A few weeks ago I posted about this on LinkedIn and it clearly struck a nerve. Hundreds of comments. DMs from brand operators asking for the spreadsheet. So I’m going deeper here.

I’ll link the tool you can copy at the bottom as well.
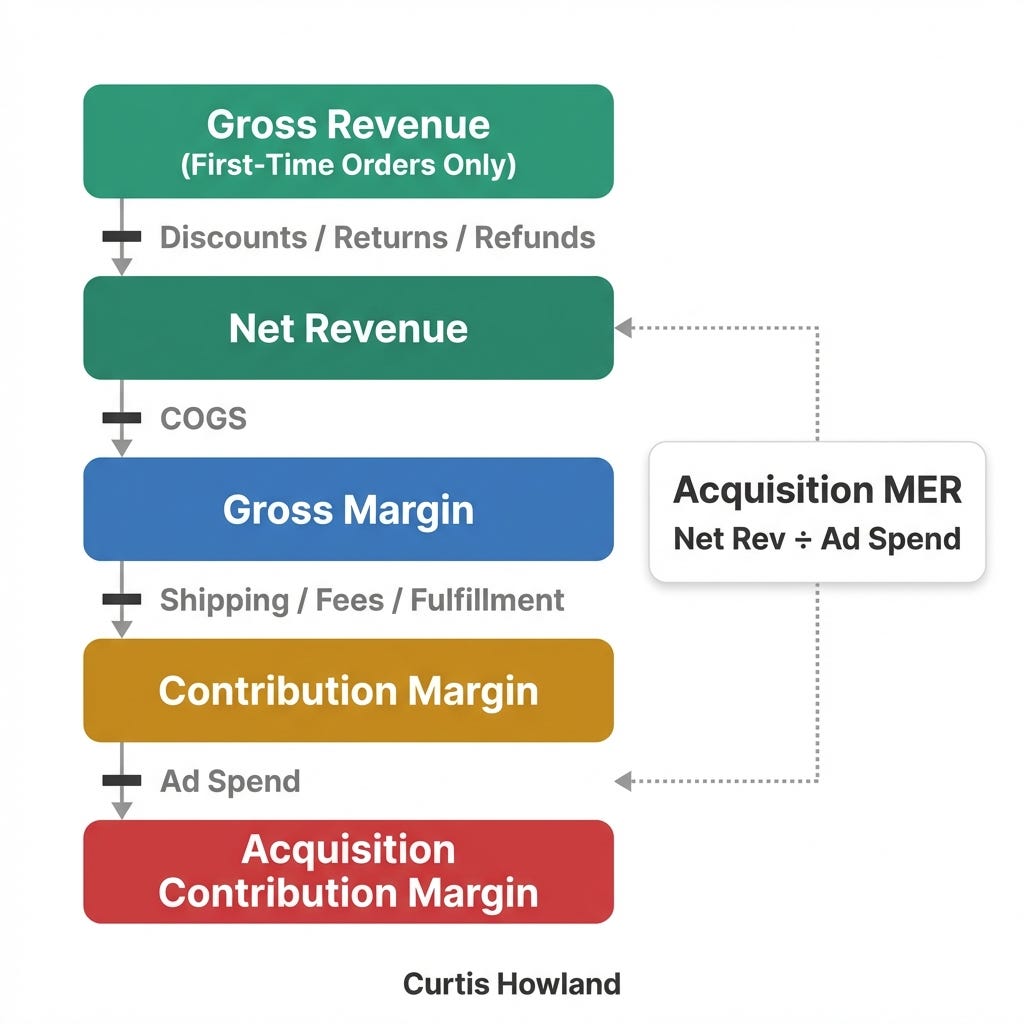
This is the framework I use at Misfit Marketing. It’s the 1st Time Customer P&L, and it isolates the profitability of acquiring a single new customer.
If you haven’t built something like this, it will change how you think about scaling.
In short, you need to slowly chip away at each level of the P&L but on a new customer basis, understand its impact and look for important ratios.
Why Blended Numbers Hide the Truth
Most DTC brands spending $50K+ per month on Meta are running into the same problem.
Meta’s algorithm is smart. Left to its own devices, it will find the cheapest conversions possible. And the cheapest conversions are almost always returning customers. People who already know your brand, already have your product, and were probably going to buy again with or without an ad.
So your dashboard shows a 4x ROAS and your CFO is thrilled. But peel the layers back and you might find that 60% of that “attributed” revenue came from customers who’ve bought 3+ times. Your actual new customer acquisition might be running at a 1.5x or worse.
And now you can’t scale. Your optimization is confused and the algorithm is targeting the wrong people.
I see this constantly. Not as a hypothetical. As the default state across most accounts I audit.
The 1st Time Customer P&L forces you to answer one question: If I strip out every dollar from returning customers, what does my acquisition economics actually look like?
That’s the question you need to answer before you ask ‘can I scale’?
The Six Layers (and What Each One Tells You)
I built a spreadsheet that walks through this step by step. You can grab a copy here: Get the 1st Time Customer P&L spreadsheet
Each layer strips away another cost. By the end, you’ll know exactly what you’re making (or losing) on every new customer you acquire.
Layer 1: Gross Revenue (First-Time Orders Only)
Start with a time period.
Pull your total revenue, then filter for first-time orders only. In Shopify, you can segment by new vs. returning customers in the Orders report.
The ratio matters. If new customer revenue is only 25-30% of total revenue, your business is heavily dependent on repeat purchasers. That’s not inherently bad, but it means your growth is capped unless you can increase acquisition volume.
In the example data from the spreadsheet, new customer revenue is about 40% of total. That’s a reasonable split for a scaling brand.

Layer 2: Net Revenue
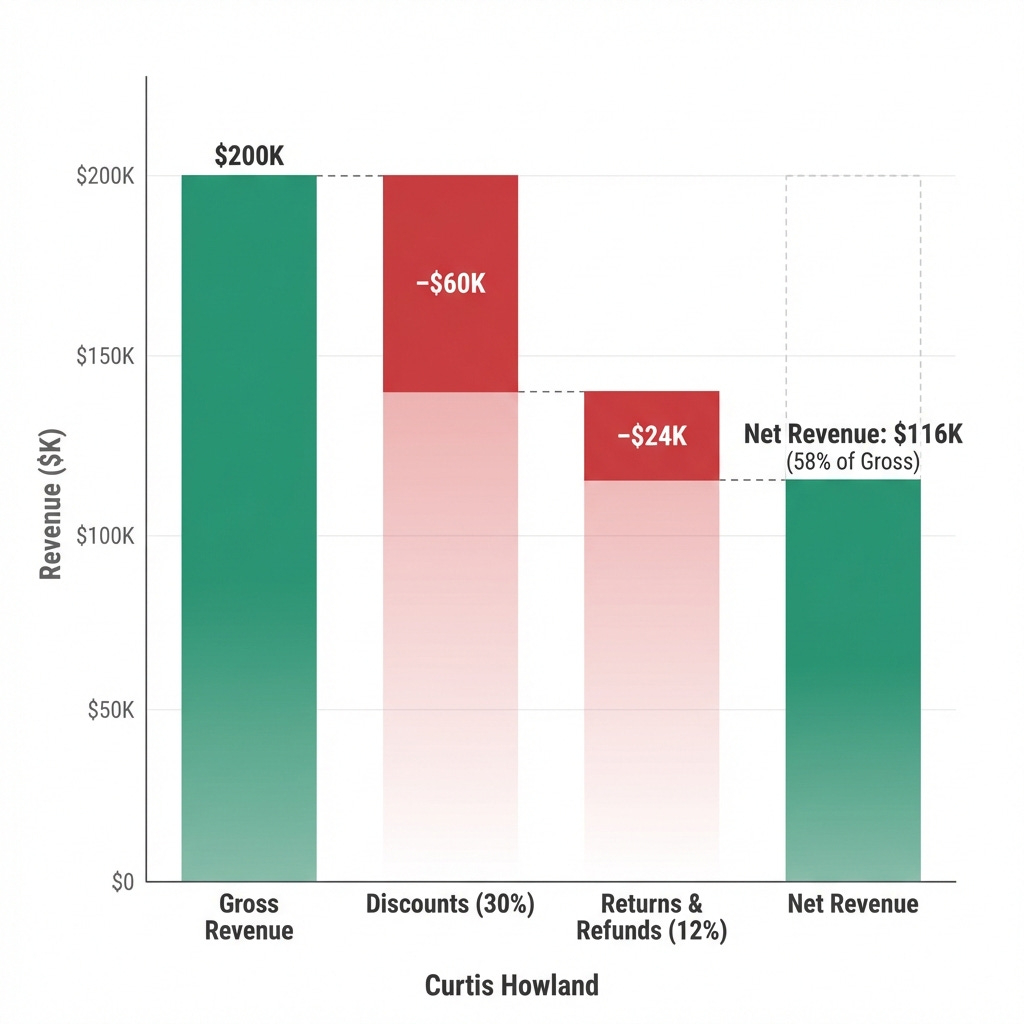
Now subtract discounts, returns, and refunds. This is where a lot of brands get a reality check.
If you’re running 30% off sitewide to acquire new customers and your returns cost another 12%, you’re losing 42 cents of every gross dollar before you’ve even touched COGS. (These blend FYI so track % of revenue returned not % of orders to make this easy).

Using the spreadsheet numbers: $200K gross becomes $116K net. That’s a 58% net revenue margin.
Layer 3: Gross Margin
Subtract your COGS from net revenue. This tells you whether the product itself is profitable before any operating costs.
If your gross margin is below 50% on new customer orders, you need to know that now. No amount of media buying optimization or creative testing fixes thin product margins. The math just doesn’t work at scale.

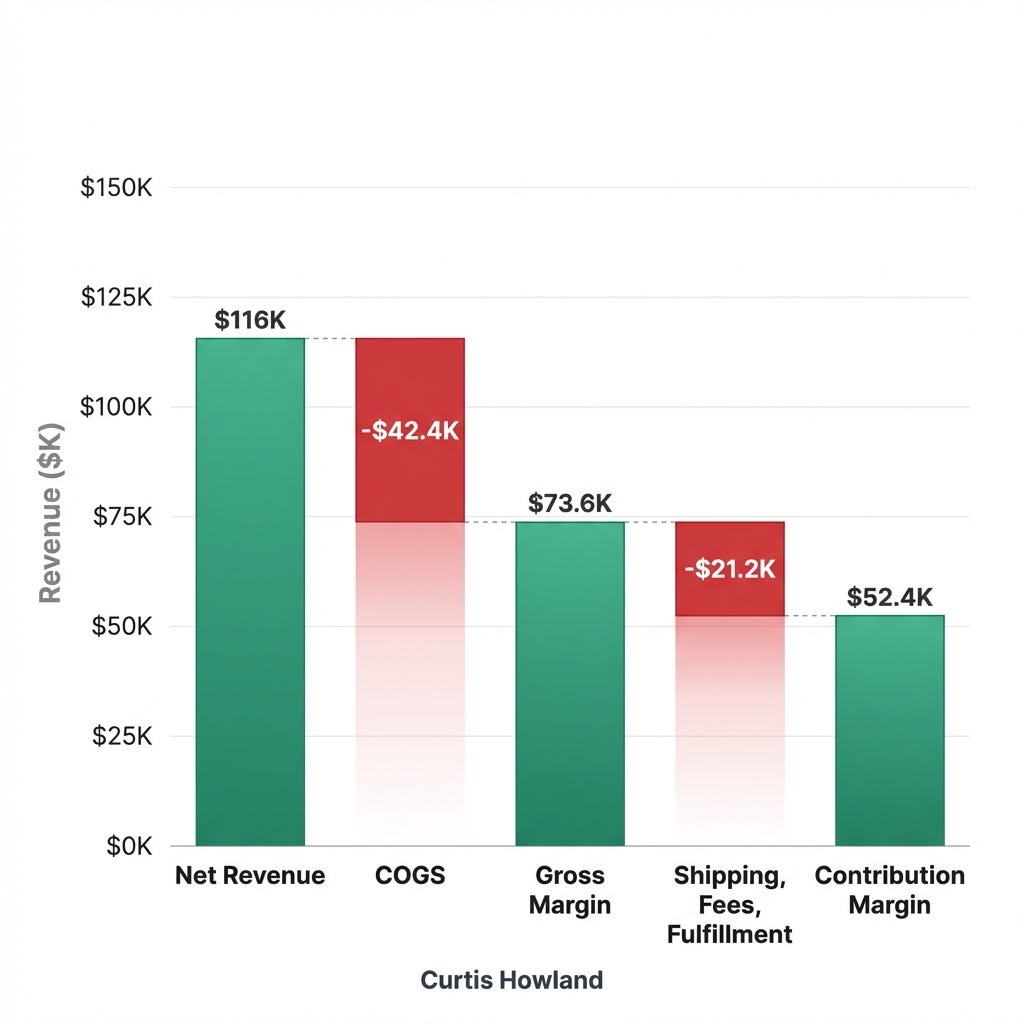
In the spreadsheet, COGS runs about 36.6% of net revenue, leaving a 63.4% gross margin. That’s solid ground to build on.
Layer 4: Contribution Margin
Now subtract the operational costs that come with every order: shipping, payment processing fees, and fulfillment (pick, pack, ship).
This is your per-order profitability before you spend a dollar on acquisition. For this model we are still just looking at new customers (this is not your standard P&L). No returning customer revenue from email or SMS or subscriptions. Just the raw unit economics of fulfilling a new customer order.

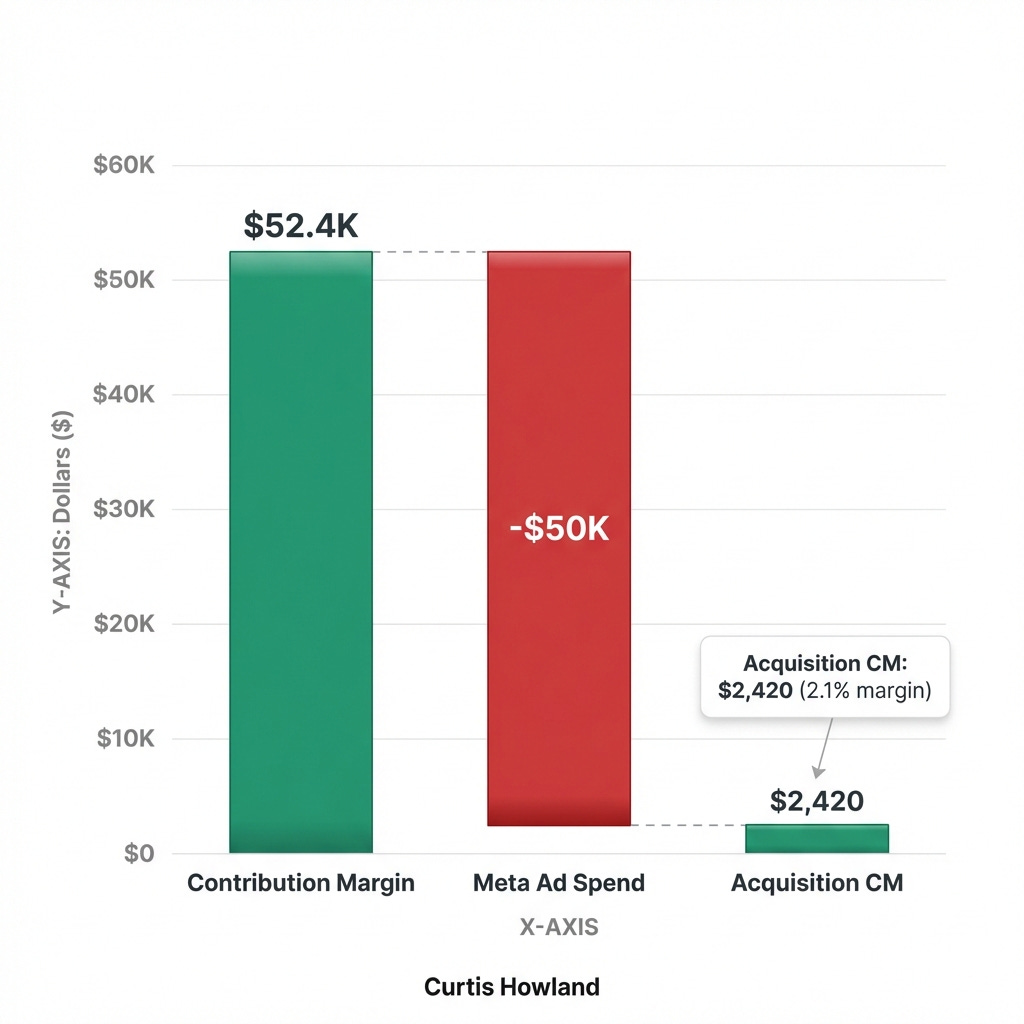
In the example: $73.6K gross margin becomes $52.4K contribution margin after ~$21K in operational costs. That’s a 45.2% contribution margin, which gives you a real budget to acquire customers with.
Layer 5: Acquisition Contribution Margin
Now subtract your Meta ad spend (or whatever your primary acquisition channel is).
In Month 1 of the spreadsheet, $50K in ad spend against $52.4K in contribution margin leaves just $2,420 in profit. That’s a 2.1% acquisition contribution margin. Barely positive.

By Month 3, with ad spend climbing to $60K while margins hold steady, the brand goes negative. Negative $2,338. Every new customer acquired that month is a loss before retention kicks in.
This is the number that tells you whether you’re building a sustainable business or subsidizing growth with future revenue that hasn’t arrived yet.
Layer 6: Acquisition MER
Net revenue divided by ad spend. This is the ratio version of Layer 5.
In the spreadsheet, Month 1 shows a 2.32x aMER. By Month 6, it’s 1.93x.
For context, I've seen aMERs range from sub-1x to as high as 10x depending on margins and expected LTV, but most dtc brands land in the 2-4x range. It depends on their margins and expected retention.

This is not your blended MER. Blended MER includes returning customer revenue in the numerator, which flatters the number. Acquisition MER strips that out completely.
If your blended MER is 4x but your aMER is 1.8x, you don’t have a healthy acquisition engine. You have a retention business with an expensive customer acquisition problem.
How to Actually Operate Off This P&L
So you’ve built the model. You know your acquisition contribution margin. You know your aMER. Now what?
The system I use with most clients runs on two caps at the same time. This works well for companies with high retention.
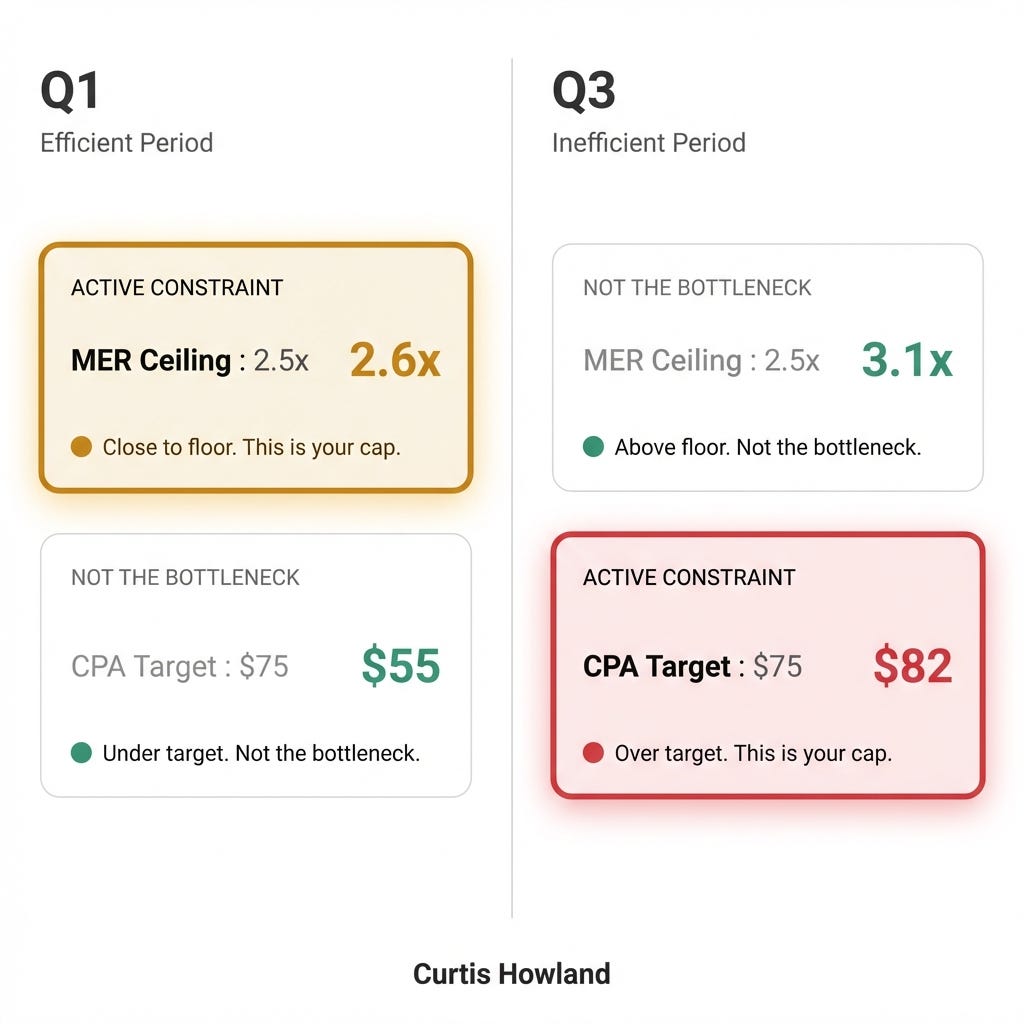
Cap 1: MER ceiling. (Total MER, not aMER) This is a total efficiency number that keeps the business profitable (or within an acceptable loss if you have funds to grow). Total revenue divided by ad spend, with a minimum threshold. Something like: “As long as we’re above a 2.5x total MER, Shopify is generating the margin we need.” This cap protects cash flow. And unlike the acquisition-only aMER, this one includes all revenue: new, returning, subscriptions, type-in orders, everything.
Quick note on that last point. A lot of brands don’t realize how much returning non-paid revenue they have. Customers who come back and type in your URL, click a bookmark, or repurchase outside of any retention flow. On some brands I work with, this can be 20-30% of total Shopify revenue. That revenue matters for your MER ceiling because it offsets your real cash outlay, even though it doesn’t show up in the acquisition P&L.
Cap 2: CPA target. This is a unit economics number that keeps customer acquisition sustainable. Based on your retention assumptions, you calculate the maximum CPA at which a new customer becomes profitable by a specific month (Month 3, Month 6, whatever your business can handle). This cap protects long-term profitability. This is where the 1st Time Customer P&L directly feeds your daily decisions.
In efficient periods on a business willing to lose money on first purchase (Meta performing well, CPA is low, and LTV is high), the MER ceiling is usually what caps you. You could acquire customers more cheaply, but the business can only absorb so much spend before total cash outlay is too high.
In inefficient periods or low LTV businesses, the CPA target is what caps you. You might have room on MER, but individual customer economics don’t justify the spend.
Your media buyer checks both numbers daily. Whichever one is tighter, that’s the constraint. Scale up to it, but don’t blow past it.
If you have to be profitable on first purchase from paid spend then you can skip this and just focus on CPA. In that case, as long as your marginal spend is profitable on new customers, more spend on acquisition = more business profit.
In that scenario (average CPA profitable) your second cap is marginal CPA instead.
Two Breakevens (and Why Most Founders Confuse Them)
Once you build the P&L, the next question is always: “When do we break even?”
But there are two completely different versions of breakeven.
Cohort breakeven answers: “The customers I acquired in January, at the CAC I paid in January, when does that specific group become profitable?” If your January cohort breaks even on the second rebill, those specific customers have now paid back what you spent to acquire them.
Cash breakeven answers: “Looking at total cash in and cash out each month across all cohorts, when does the business stop being net negative?” Even if every cohort breaks even on the second rebill, you can still be cash negative for months if you’re scaling spend aggressively, because the newer cohorts haven’t had time to pay back yet and they are larger than previous cohorts so they move the average.
VP of finance might say “we break even at month eight or nine” while the media buyer says “we break even on the second rebill.” Both right. Completely different measurements.
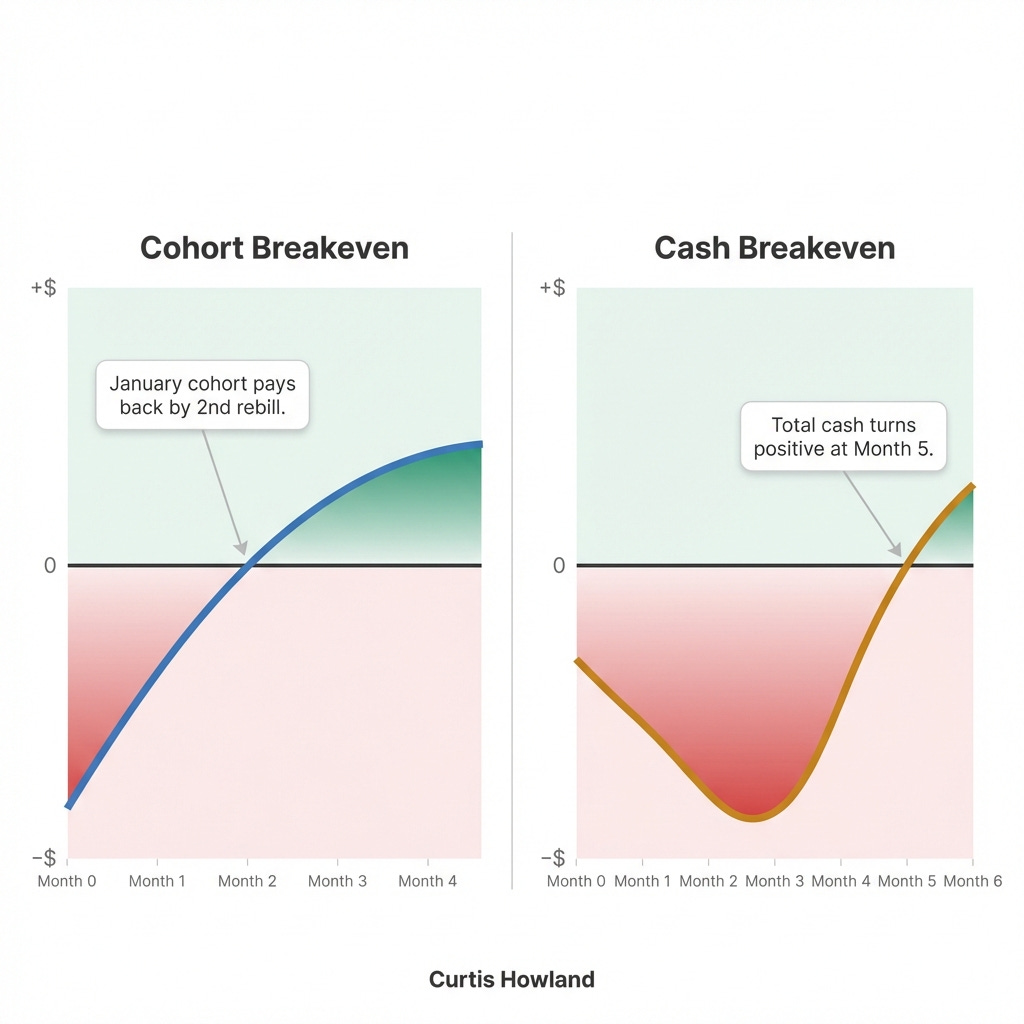
So you need to model this out to make sure you have both the customer profitability but also the cash flow ability to spend.
Want to learn more? Explore this tool:
https://www.curtishowland.com/tools/cashflow-projection
The 1st Time Customer P&L spreadsheet shows you cohort-level breakeven. But if you’re managing cash flow, you also need to model the cumulative cash impact of scaling spend month over month.
Cohort breakeven tells you whether the unit economics work. Cash breakeven tells you how fast you can scale without running out of money. You need both.
Retention Is the Whole Ballgame
The spreadsheet includes a section most brands never think about: how much does retention need to recover?
If your Acquisition Contribution Margin is negative (and for a lot of scaling brands reliant on LTV, it will be), you need to know the exact dollar amount that email, SMS, and subscriptions have to generate to get you back to breakeven.

In Month 3 of the example, that number is $2,338. By Month 6, it’s $9,475. If your retention channels can’t reliably produce that, you’re burning cash to acquire customers who may never pay you back.
Retention is what determines whether negative acquisition economics are survivable or not.
Make sure you understand your retention very carefully
Don’t model retention as a single curve. Break it by cohort and by policy period. If you changed your cancellation flow, your refund policy, or your subscription default, your older retention data is not predictive of your newer cohorts.
What Happens If You Turn Off Ads?
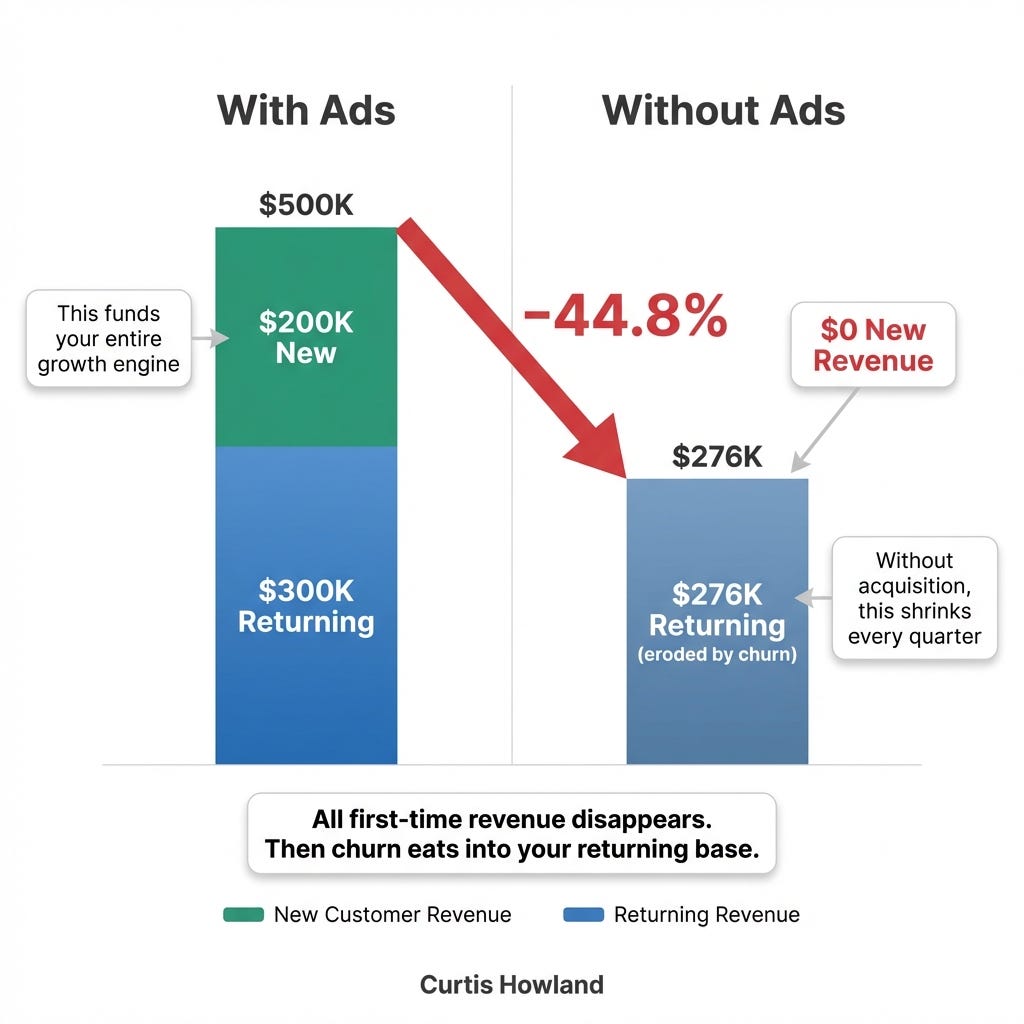
Section 8 of the spreadsheet models this. All first-time revenue disappears immediately. Then churn eats into your returning customer base at whatever your monthly rate is (8% in the example).

The result in the spreadsheet: a 44-46% revenue drop. That’s your burn rate. That’s the number that tells you how dependent your business is on continuous acquisition spend.
It’s worth calculating, not because you are going to turn off ads, but because knowing the number changes how you think about risk. If 45% of your revenue vanishes without Meta, you need to know that.
A Real Example
We scaled a brand from mid-eight figures to well into the nine figures. One of the key levers (outside of media buying and creative) was building a clear picture of their first-time customer profitability.
Before we got involved, their marketing spend was generic and had poor exclusions set up. Meta’s algorithm was doing what it does best: finding the cheapest conversions. Which meant it was serving ads to returning customers who were already repurchasing.
Their reported CAC looked fine. But their new customer acquisition cost was buried.
When we forced Meta to prioritize new customers (using exclusion audiences and Advantage+ controls), the overall cost per acquisition went up initially. That’s expected. But the cost per new customer acquisition started coming down because Meta was finally optimizing for the right objective.
We moved recurring customer engagement to email, SMS, and subscriptions. Channels that are way more efficient at retention than paid ads.
Six months later, their nCAC was lower than their previous blended CAC. Meta had learned who the right new customers were and was targeting them effectively.
The 1st Time Customer P&L was an important tool that made that shift possible.
How to Build Yours
You don’t need anything fancy. A spreadsheet works.
Step 1: Download your customer data segmented by new vs. returning from Shopify (or whatever platform you’re on). You need order count, revenue, and discount amounts split by customer type.
Step 2: Pull your discount totals and return/refund amounts for new customer orders specifically. A lot of brands track these in aggregate but not by customer segment. Fix that.
Step 3: Get your COGS per product (or a blended average if your catalog is large), and your per-order costs: shipping, payment processing, and fulfillment. Again, just look at new customers here in case it’s different.
Step 4: Pull your acquisition-specific ad spend. If you’re running Meta with proper audience segmentation, this should be straightforward. If everything is in one campaign with poor targeting, you’ll need to estimate the split.
Step 5: Plug it all into the spreadsheet. The formulas handle the rest.
One more thing: if you have multiple offers at different price points, do NOT blend them. Build a separate P&L for each offer. I’ve seen brands where the main offer is profitable on first purchase and the introductory offer loses money for six months. Averaging those together tells you nothing useful. Break them apart.
Grab a copy of the 1st Time Customer P&L spreadsheet here.

Final Notes
If your acquisition contribution margin is positive, you have a machine. Scale it.
If it’s negative, that’s not automatically a problem. But you need to know exactly how much retention has to recover, whether your retention data is real or policy-driven, and whether your channels can actually deliver.
Set your two caps. MER ceiling for cash flow, CPA target for unit economics. Check both daily. Let the data tell you how fast to grow.
The brands that win long-term are the ones that know their first-time customer economics. Not blended. Not averaged. Isolated, measured, and managed monthly.
Build the P&L. The numbers will tell you what to do next.
If this was useful, send it to your team or share on LinkedIn with your favorite graphic and tag me! Best compliment you can give!
Want more content like this? Check out my last podcast: