

The biggest mistake I see in ad accounts is simple:
Founders look at CPA and ROAS and assume everything below that line is a mystery.
They treat the ad account like a black box. “Is performance good? Yes/No.”
But looking at ROAS to judge your media buying is like looking at “Revenue” to judge your entire business health. It tells you the result, but it doesn’t tell you how you got there or what’s about to break.
To actually scale, you need to get granular.
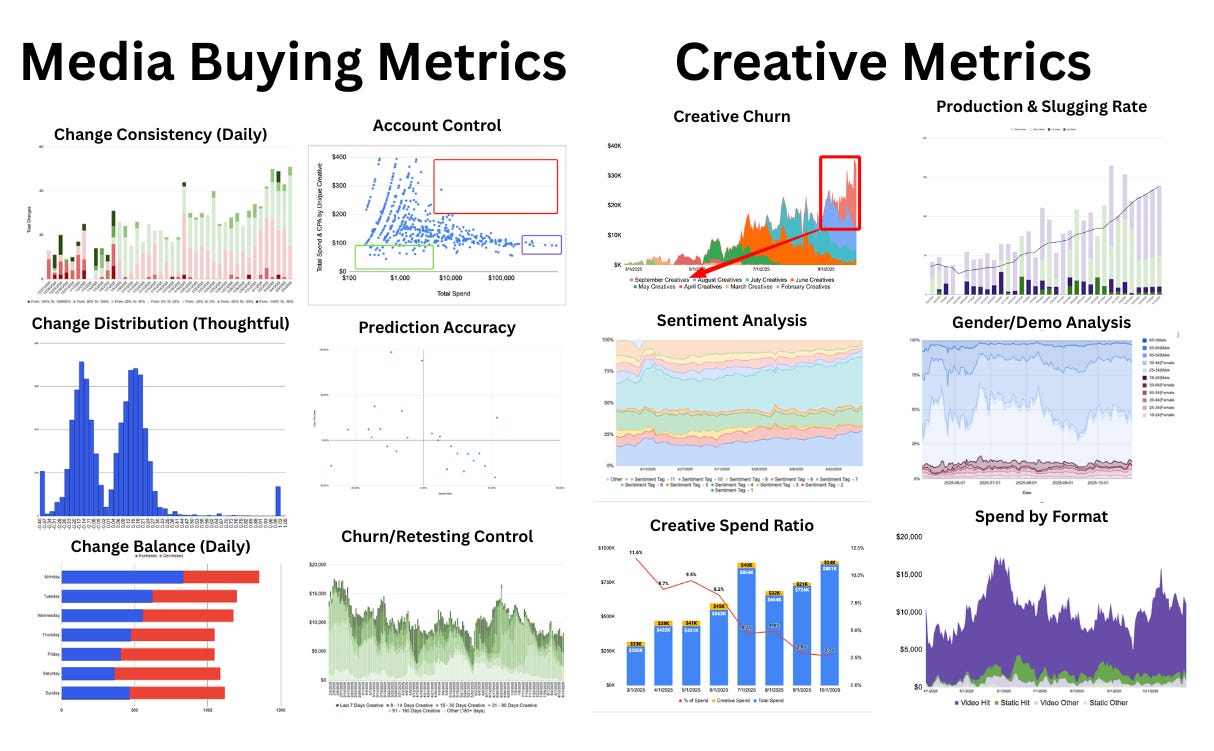
I break my tracking down into two distinct buckets: Media Buying Operations (The Left Side) and Creative Supply Chain (The Right Side).
Here are the 12 charts I use to predict the future of an account.
Part 1: Media Buying Metrics (The Behavior)
These 6 charts tell you if your buyer is actually doing their job or just guessing.
1. Change Consistency (Daily) Most buyers are erratic. In the chart above (top left), the dark bars represent massive 50%+ changes to budgets. We ran a test: We doubled the number of changes but cut the size of the changes in half (under 25%). -> The result? Performance increased 35% in 30 days. Small, gradual adjustments beat big, panic-induced swings.
2. Account Control This scatter plot tells you the state of your portfolio. You need to see clear clusters:
Testing: Low spend, mixed CPA.
Scaling: High spend, good CPA. If you have high-spend/high-CPA ads (zombies) or low-spend/low-CPA ads (untapped winners), you aren’t managing the account. You’re letting it drift.
3. Change Distribution (Thoughtful) Are your changes actually based on performance? Most of your changes should be small (<25%). If you are constantly making 50%+ budget swings (the “More” bucket), you are destabilizing the algorithm. Save the big swings for the outliers.
4. Prediction Accuracy This is the ultimate test of a media buyer.
When you cut a losing ad, does your blended CPA actually go down the next day?
When you scale a winner, does volume actually go up without ruining efficiency? If your changes aren’t producing the predicted mathematical result, you are just guessing.
5. Change Balance (Daily) Some buyers only optimize on Wednesdays and Fridays. This is lazy. If you wait until Friday to fix a problem that started Tuesday, your account falls apart mid-week. You need to be in the account daily, making small adjustments to guide the algorithm.
6. Churn & Retesting Control Are you addicted to your old winners?
Light Colors: Old ads.
Dark Colors: New ads. You need a healthy mix. If you are 100% reliant on ads from 6 months ago, you are fragile. If you never retest old winners, you’re leaving money on the table.
Part 2: Creative Metrics (The Supply Chain)
You cannot media buy your way out of a bad creative supply chain. Even if you use ASC, you need to track the inputs.
7. Creative Churn This is the most critical chart for forecasting. The different colors represent “cohorts” of creative launched in a specific month. If the “new” cohorts (darker colors) aren’t taking over the spend from the old ones, your performance is about to nosedive.
8. Production & Slugging Rate This tracks your “At Bats” vs. your “Hits.”
Bars: How many new ads you launched (Volume).
Dark Sections: How many of them actually worked (Hit Rate). If you launch 50 ads and zero of them scale, you don’t have a media buying problem. You have a creative strategy problem.
9. Sentiment Analysis Stop looking at just “Video vs. Static.” We tag creative by angle (e.g., “dry hair problem” vs. “volume problem”). If the “dry hair” angle is dominating spend, you don’t need more generic videos. You need 5 more variations specifically about dry hair.
10. Gender/Demo Analysis Are you producing for the audience that is actually buying? If women 45+ are driving your profit, but you keep producing TikTok-style ads for Gen Z, you are burning cash. Align your production queue with your paying demographic.
11. Creative Spend Ratio How much are you spending on production vs. media?
Target: 3-10% of your total media budget.
Agency Target: Up to 15%. If you spend $100k on ads and $500 on creative, you will eventually starve the account.
12. Spend by Format Don’t believe the gurus who say “only run video” or “only run static.” Look at where your money is actually going. In the chart above, we track Video vs. Static vs. Carousel. Let the data dictate the format, then produce into the format that wins.
Bottom Line
You can’t fix what you don’t measure.
If your media buying is erratic, you confuse the algorithm. If your creative pipeline is too slow, you die by fatigue. If you only watch ROAS, you’ll see the crash after it’s too late to fix it.
Build the dashboard. Watch the inputs. The ROAS will follow.
Where can I find the guide on setting up these charts? I would love to set this up for clients.
This was a great post. At least when it comes to Meta where they may show some creative to a more top of funnel audience (prospecting) compared to other ads in the same account that are going to lower in the funnel audience. It's hard to tell if the ad is truly being effective because it might spend with a high CPA but it might be attributing more to other ads making their CPAs seem considerably lower.
I love your analysis but how do you account for this?
I have not had the opportunity to run TikTok ads just yet so this might be a meta only issue (excluding Google for this).