

When an account stops scaling, the instinct is to blame the algorithm, the offer, or the economy. The first place I check, though, is creative production. It’s something you actually control closely and is often the culprit.
I check three charts before anything else. They answer three questions, in order:
Do you have clear winners that are scaled? (Concentration/Optimization)
Are you producing enough winners, and are they winning at a healthy rate? (Hit rate)
Do those winners last, or do they burn out fast? (Creative half-life)
Run all three and a gap almost always shows up in one of them. Even if it’s not the key thing causing your issues, you’ll still likely find some learning to push into.
One note before we start: this is our internal dash, but the charts below come from demo data, which are realistic examples, but the numbers will not tie out across the three images.
1. Concentration: How Much Rides on Your Best Ads
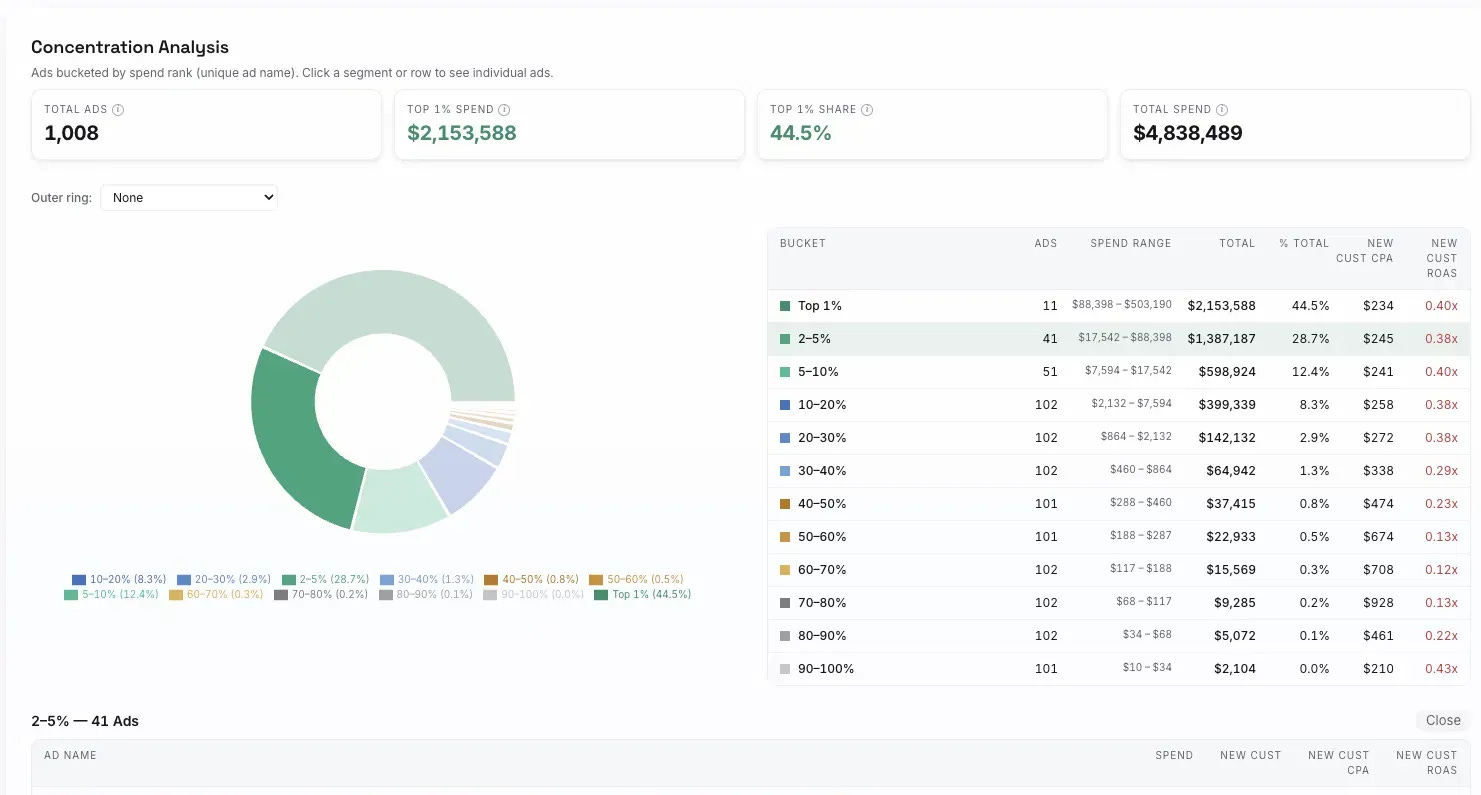
What it is: take every ad that spent in a window, rank them by spend, and look at what share of total spend the top slice controls.
What you will almost always see: the top 10% of ads should be north of 75% of spend. In a lot of accounts it is higher than that.
Your goal is to balance concentration. Around 40-50% on the top 1% and 75% on the top 10% is good concentration in my experience. It means Meta is doing its job. The platform runs on a power law, where a small number of ads produce most of the results, and delivery concentrates budget into the ads that clear the bar. Those top ads genuinely outperform, so you want them taking the largest share of spend. Flat, even distribution is the warning sign, because it usually means the algorithm has not found clear winners to scale into, or you are manually spreading budget across mediocre ads.
If you are seeing 70-75% of spend on the top 1% of ads, that is also a warning sign that you are over-concentrated and at risk of fast fatigue.
The reason this chart goes first is that once you accept a handful of ads carry the account, everything else follows.
You are not building a big library of decent ads. You are continuously producing the few that Meta will pour money into, and then replacing them as they fade.
2. Hit Rate: Are You Producing Enough Winners
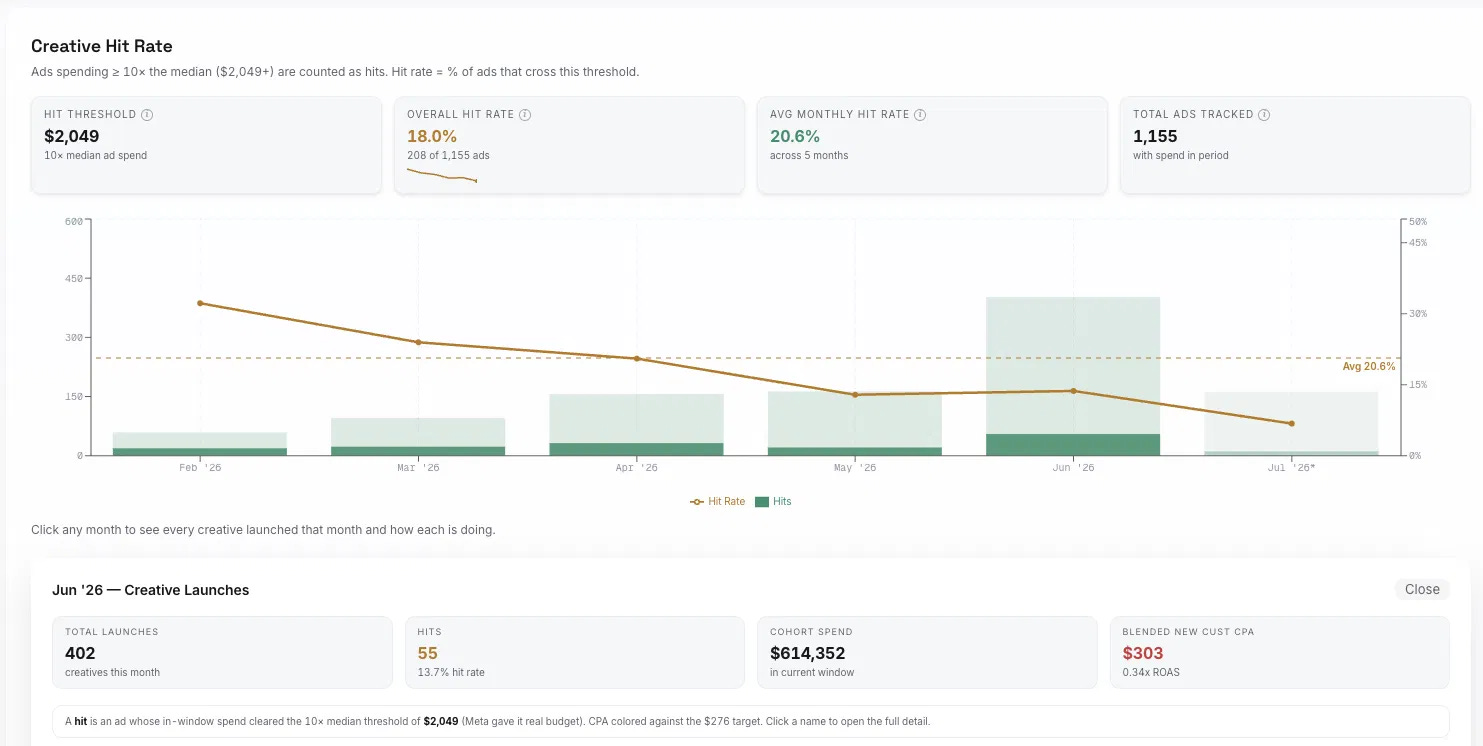
Each month is a bar chart. The dark color is the hits, and the gold line is the percentage rate
What it is: of all the ads you launched, what percentage became winners? The cleanest way to define a winner is by spending (assumes good media buying). An ad is a hit if Meta gave it real budget, meaning its spend cleared some multiple of your median (10x median is what I use).
Why define a winner by spend instead of ROAS or CPA? Because Meta’s own budget allocation is the least noisy signal you have. If the algorithm poured spend into an ad, it found the ad worth scaling. You do not have to untangle attribution to know the platform voted for it. Plus Scalable ROAS is more important than early ROAS.
This chart answers two questions: are you launching enough ads to produce the winners you need, and are they hitting at a healthy rate.
The benchmark: a healthy monthly hit rate sits around 10% to 15%.
Below 10%: you are producing too much. You are flooding the account with ads, most of which never get off the ground, and diluting your own signal.
Above 15%: you are producing too little, or without enough diversity. If a high share of what you launch ends up getting spend, you usually are not giving the algorithm enough candidates to choose from, so you end up forcing budget into ads instead of letting the best ones earn it against a wide field.
Read the level and the trend together. If you were scaling well at 10% hit rate and then it dropped to 5%, focus on the drop, not the absolute number.
Then read it against volume. Because so few ads carry the account and winners fade (chart three), you need enough absolute hits every month to replace what is churning and add more on top. A perfect hit rate on too few launches still will not produce enough winners to grow.
* one important caveat is that this chart naturally drifts down. For example, if you are in the middle of August, there are some ads that you’ve launched that are not yet hits and will become hits in the next few weeks as they spend more. You can either adjust this chart to look at the first 7 days of spend, or just get familiar with how the month progresses over time as it matures
3. Creative Half-Life: Do Your Winners Last
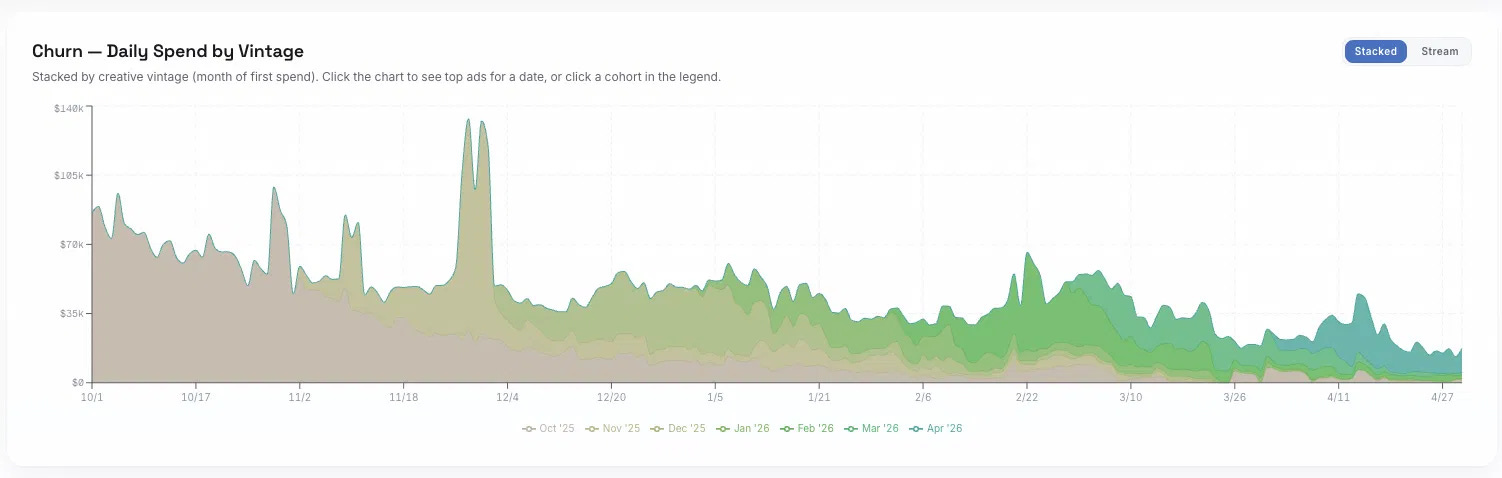
Each band is a creative vintage, the month it first spent. Every cohort peaks and then decays.
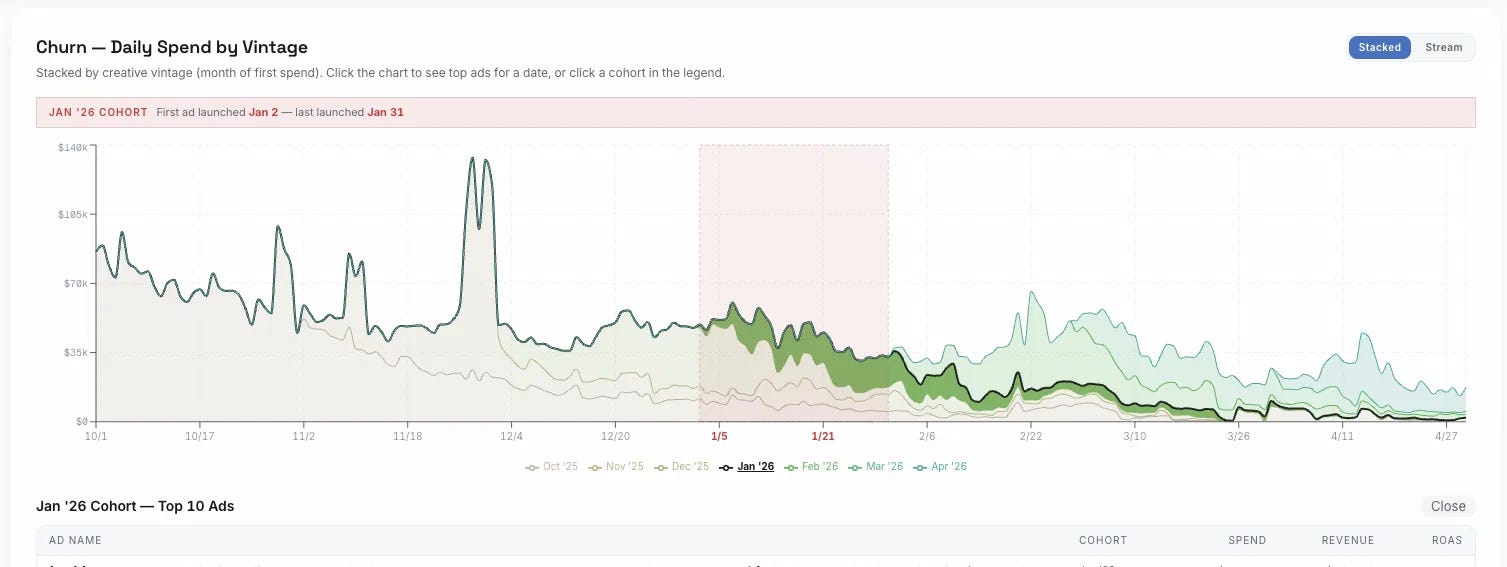
Drill into one vintage to see its half-life. This January cohort launched in January and kept bleeding spend for months after.
What it is: stack daily spend by the month each ad first spent (its vintage), and watch how each month’s cohort rises and then decays. Click into a single vintage and you can trace exactly how long that batch of creative held up.
What you will see: creative fatigues. Every cohort peaks and fades. Nothing spends forever.
The benchmark I use: creative half-life is roughly 60 to 75 days. Put another way, expect about 25% to 30% of a cohort’s spend to churn each month.
Say you spend $100,000 on a set of ads this month. To hold the same CPA next month, you should expect only $70,000 to $75,000 from that same set, because a chunk of it will have fatigued. To keep CPA flat, you have to replace the $25,000 to $30,000 that fell off. To grow, you have to replace it and add more on top of that.
That is the treadmill, and it is why hit rate and volume are never one-time efforts. You are not filling a library, you are refilling a leaking bucket.
What to do here: drill into your cohorts and find the ads that outlasted the half-life. Study what made them durable, then reverse-engineer the system that produced them, not the exact ad.
Putting It Together:
If you are struggling to scale, this is the scan:
Concentration: is spend actually concentrating into a few winners? If it is flat, Meta does not have clear winners to scale into or you have a structure issue.
Production: are you launching enough, hitting in the 10% to 15% band, and are those winners sustaining?
Durability: are your winners lasting 60 to 75 days, or dying faster? (i.e. you need more creative for any number of reasons)
When you find the gap, go back and diagnose it directly:
Which month dropped off?
What were you producing that month versus your best months?
What is different, both in output (how much you shipped, and how much of it was variations versus net-new concepts) and in systems (how you were researching, briefing, and iterating)?
A couple of common causes worth checking.
You might be running too many variations. If you have already researched a concept heavily and squeezed it hard, more variations of it hit diminishing returns fast. That is often the culprit when output is high but hit rate is falling.
Or you might be running too many net-new concepts, spraying fresh ideas without building on what actually worked.
Either way, the fix is not to copy your old winners line for line. It is to understand the system that produced them (the research, the angle-finding, the process) and re-run that system. The winners were an output. The system is the thing you rebuild.
This is why drilling in matters. Click into a strong month and study the top ads and the creators behind them. Click into a weak month and ask what you were making and why it did not land. You learn far more from the structure of a good month next to a bad one than from any single ad.
Hope this helps!
Curtis
Do you use point one to define the number of creatives per week?
Heyy, you use Claude for this dashboard or other app (Parker, motion etc)