

How many ads should you launch?
In a recent LinkedIn post I laid out five methods, ordered simple to complicated.
Capacity.
Spend per ad.
Spend per concept.
Calibrated to revenue.
Churn replacement.
I still think method 1 is the right answer for most people reading this. Just go film and stop worrying about systems. (like now, make some ads).
This post is about method 2, because it’s the one that gets copied, and it’s the one I want to share some nuance on.
The rule: total ads equals target spend divided by $3,000.
Do People Really Use It?
The rule is about launches. New creative going into the account each month. It’s not about how many ads are running, and that distinction matters more than it sounds like it should.
So let’s check it against what big accounts actually launch.
Motion’s 2026 benchmarks cover more than 550,000 Meta ads and about $1.3 billion in spend. In their top tier, accounts at $1M a month or more, the average account ships 18.85 new creatives a week. The top quartile ships 54.64.
Now run my rule at the very bottom of that tier. At $1M a month, one new ad per $3,000 gives you 333 new ads a month. Call it 77 a week.
Top quartile ships 54.64.
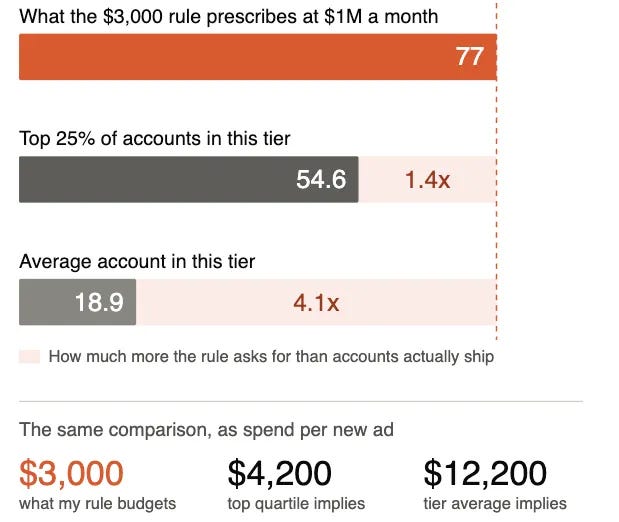
So even at the floor of the tier, where the rule looks its best, it’s asking for about 1.4x what the strongest accounts actually produce. Against the tier average it’s asking for four times as much.
And $1M is the floor. Higher spend = more ads.
So very few brands are hitting that.
The ones that I personally know are scaling well? They are, which is why I stick to that number.
But importantly, they are doing so with strong creative strategy, diversity, and careful attention. Not just AI slop.
Spend Per Ad Is an Average of a Power Law
You don’t set spend per ad. The account hands it to you at the end of the month, and the distribution behind it is lopsided enough that the average barely means anything.
For example, in an account.
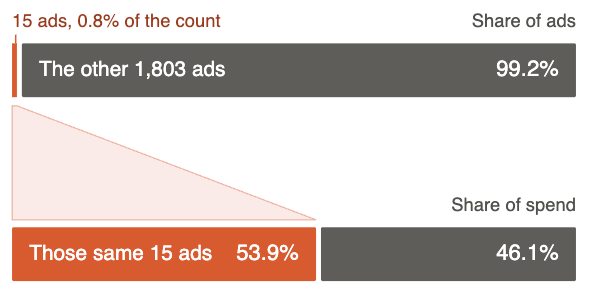
The top 15 ads, 0.8% of the ads, carried 53.9% of the spend. One ad carried 6.9% of everything by itself. That single ad was running at about 25x per month what my rule budgets for an ad.
Motion sees the same shape at scale. About 6% of ads drive most of the spend in any account, and roughly half barely spend at all.
So when you divide total spend by ad count, you’re averaging a power law. The answer lands nowhere near where the money went.
Then more issues:
Break the same 90 days out by creative archetype and spend per ad swings 29x between the top and the bottom. Same account, same quarter.
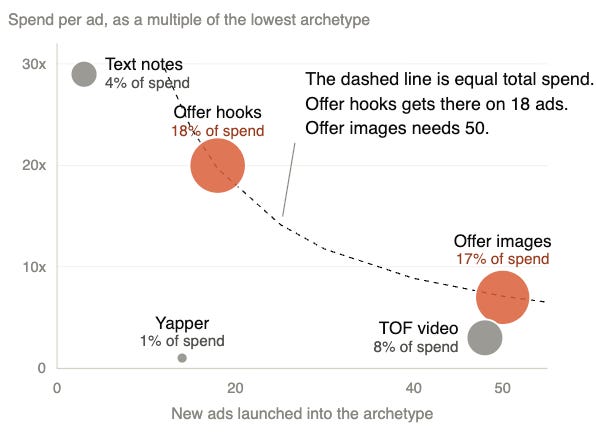
The best ads may not be the highest produced…
Make a lot of ads and then make more of the best!
Don’t Check It Against the Wrong Number
I’ve heard a few people follow this process: You open Ads Manager and you see active ads. They then compare spend to that number.
That’s not what I’m suggesting here.
Active ad count isn’t something you pick. It’s downstream:
Active ads ≈ monthly launch rate × your ad churn and media strategy
However, we can use this to nuance the $3k rule through churn + hit rate adjustments:
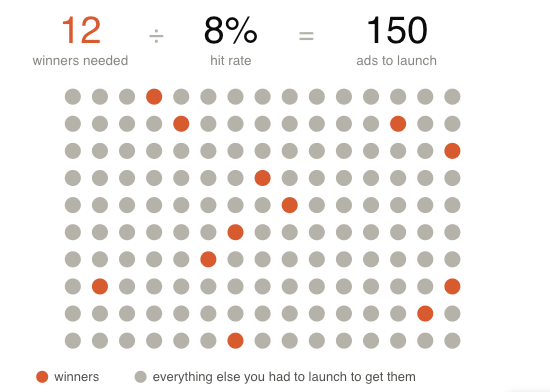
How many fresh winners do you need each month? At 25% to 30% churn, enough to replace what’s rolling off plus whatever growth you’re underwriting. If you are above that? You need more ads (or more diversity of ads).
What’s your actual hit rate? Motion measures about 5% overall and 8% to 9% for enterprise, counting a winner as an ad that spends 10x the account median. Measure your own and if it’s lower? You need more ads (or higher quality strategy).
Winners needed divided by hit rate equals launches needed.
Check that against capacity. If the number is bigger than what your team can build at quality, that’s a production problem, and no bid strategy is going to fix it.
Shipping More might Fix CPA
I don’t want any of this read as permission to just ship more. I’m not in the ship everything boat (to be fair, I don’t think anyone seriously is, but that’s another conversation about sales tactics).
Let me give an example, January to July: active ads up 2.07x. Blended platform-reported ROAS up about 39%.
I’m not saying ad count caused that.
What I will say is narrower. Volume buys you shots on goal. It doesn’t buy a better shot. However if your shots on goal are diverse, strategic, and increase by 2x odds are you will score more points.
I’ve seen the opposite issue though “Twitter said we need to launch more ads so we need to bring on this new tool that cranks out AI statics and just pushes them live in the account” 6 months later?
Ads are up 10x, ROAS down 40% and spend down.
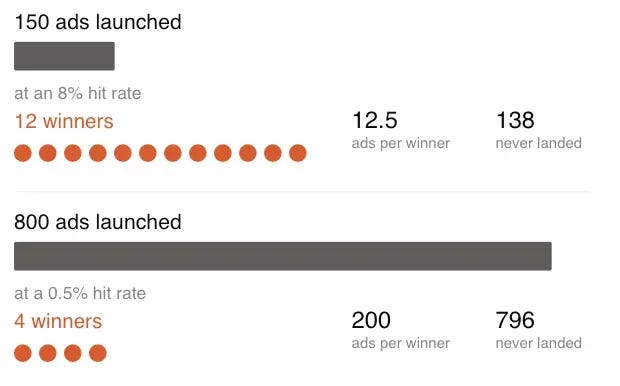
Just kicking a million balls in a random direction is not what I’m suggesting.
The Caveat
Averages are useful for working out whether you’re weird. They’re not much use for deciding what to do next, because the average account isn’t scaling rapidly.
Set a strategy, set a hypothesis and test. Measure output and decide if X number is the right target for your company, product, and customers.
Curtis
Sources
Motion, 2026 Creative Benchmarks Report (550,000+ Meta ads, ~$1.3B spend, 6,000+ advertisers): https://motionapp.com/library/talk/meta-ads-in-2026-how-many-creatives-do-you-actually-need-to-launch/
Motion tier tables via Foxwell Digital: https://www.foxwelldigital.com/blog/motion-creative-benchmarks-2026-8-key-takeaways
Taylor Sicard, Meta Ads Creative Benchmarks 2026: https://taylorsicard.com/blog/meta-ads-creative-benchmarks-2026
MHI Growth Engine, creative testing volume: https://mhigrowthengine.com/blog/how-many-creatives-to-test-meta-ads/
Billo, 2026 DTC creative volume benchmarks: https://billo.app/blog/how-many-ad-creatives-do-you-need/