

BFCM is five weeks out. Every good ad you cut now is one less ad finding new customers in November.
I’ve run 20,000+ ads on Meta and I cut fast. Most ads don’t deserve a second week. But cutting fast only works if you’re cutting on the right number.
The Cut Line Moves With Spend
A lot of people want a specific number for when to cut. But cutting is obviously different at $1,000 of spend versus $100.
At a $50 target:
$200 spent at an $80 CPA: keep testing.
$2,000 spent at an $80 CPA: cut it.
The chart:
Plot every ad in your account on a scatter chart.
CPA on the Y-axis.
Total spend on the X-axis (log scale).
Add two lines against your target CPA.
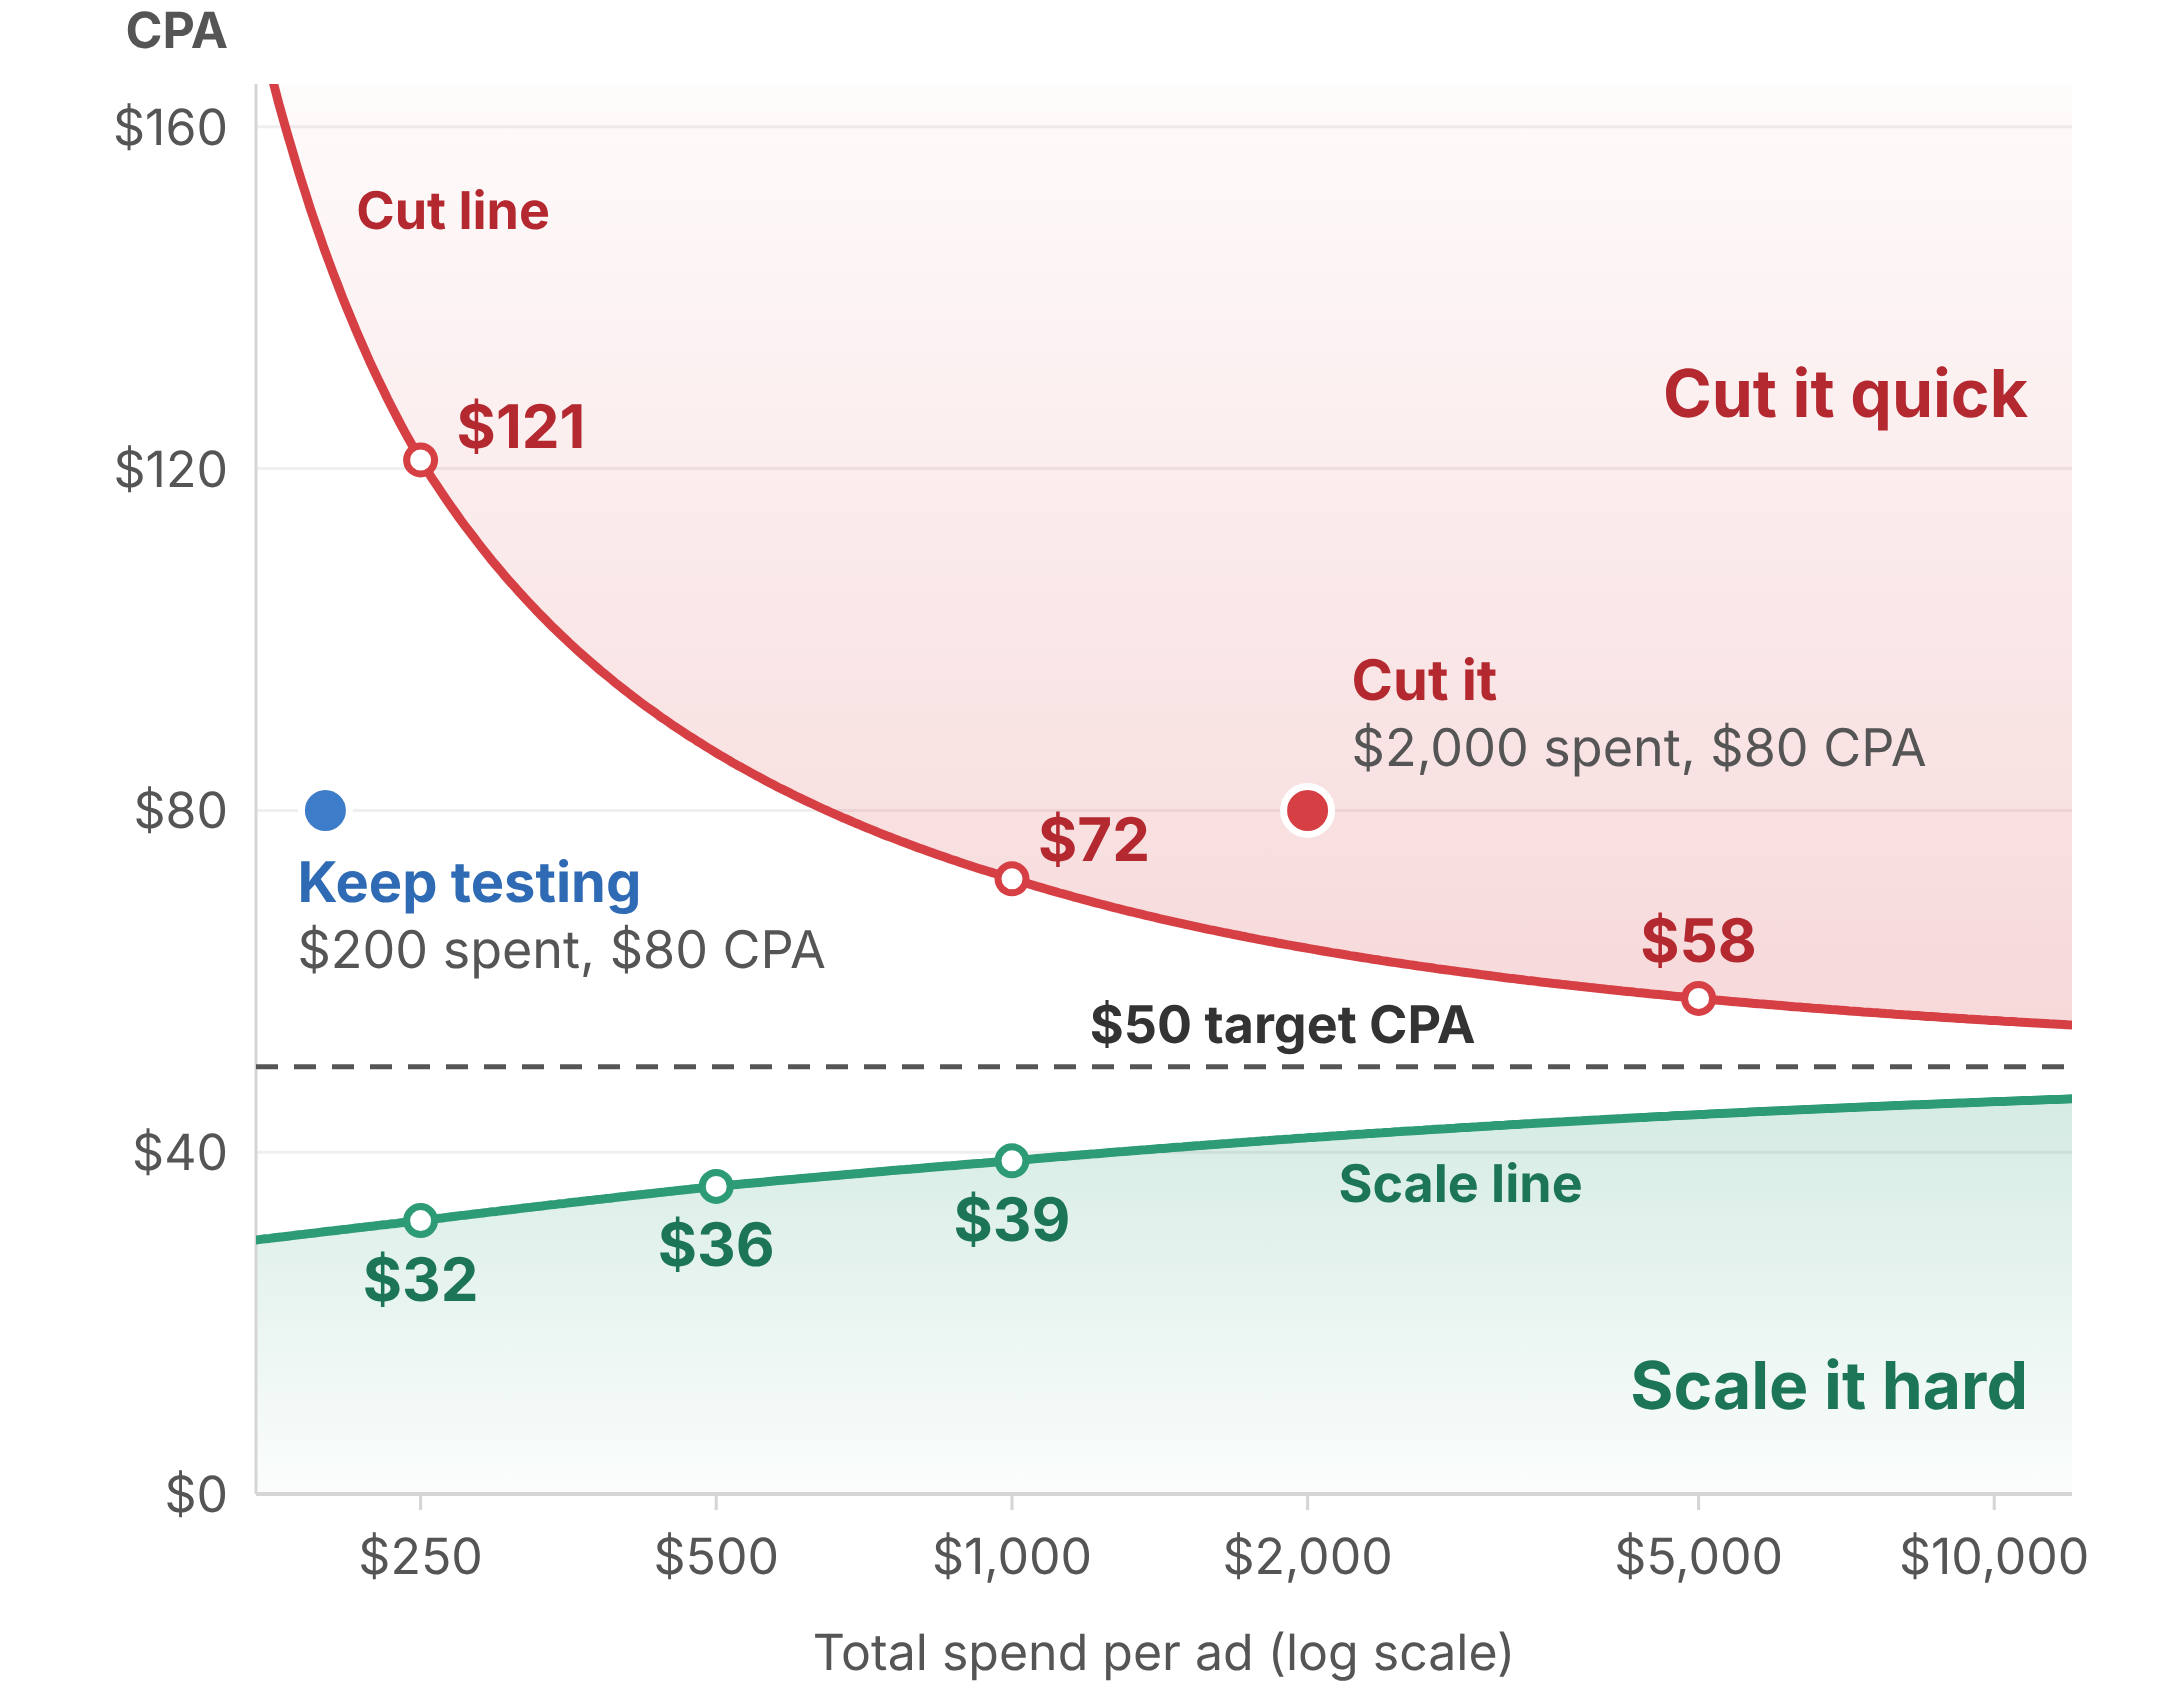
The cut line (red), for a $50 target:
At $250 spend, cut if CPA is $121+
At $1,000 spend, cut if CPA is $72+
At $5,000 spend, cut if CPA is $58+
I use 90% confidence as my cut line. At each threshold you’re 90% confident that ad’s true CPA is above target. The more data you have, the tighter the range gets.
The scale line (green):
$250 spend at a $32 CPA: scale aggressively
$500 spend at a $36 CPA: scale aggressively
$1,000 spend at a $39 CPA: start scaling in
How to read it:
Every ad is a dot.
Above the red line, cut it quick.
Below the green line, scale it hard.
In the middle, push the spend and see where it lands.
Roughly this is how it works:
5 CPAs of spend ($250 ÷ $50): cut at 2.42x target ($121 ÷ $50), scale at 0.64x ($32 ÷ $50)
10 CPAs of spend ($500 ÷ $50): scale at 0.72x ($36 ÷ $50)
20 CPAs of spend ($1,000 ÷ $50): cut at 1.44x ($72 ÷ $50), scale at 0.78x ($39 ÷ $50)
100 CPAs of spend ($5,000 ÷ $50): cut at 1.16x ($58 ÷ $50)
Ads with zero conversions have no CPA, obviously. Where to cut those:
3-5x your CPA target per concept is a decent baseline. No conversions by then, cut. On a $50 target that’s $150 to $250.
Run It on Your Own Account
My free tool, Ad Scale Scatter, draws this chart from a CSV. It runs in your browser and the CSV is never uploaded to a server.
Prospecting ads only. Stick to one product if your targets differ by product.
Last 30 days. 60 if it’s a smaller account.
Export ad name, spend and conversions from Ads Manager.
Add a date column (YYYY-MM-DD) to turn on the timeline and the daily CPA trends.
Change the CPA target to your real allowable CPA. On first load it sets itself to the account’s spend-weighted CPA.
The tool calls the three zones SCALE, WAIT and KILL. KILL is everything above the cut line.
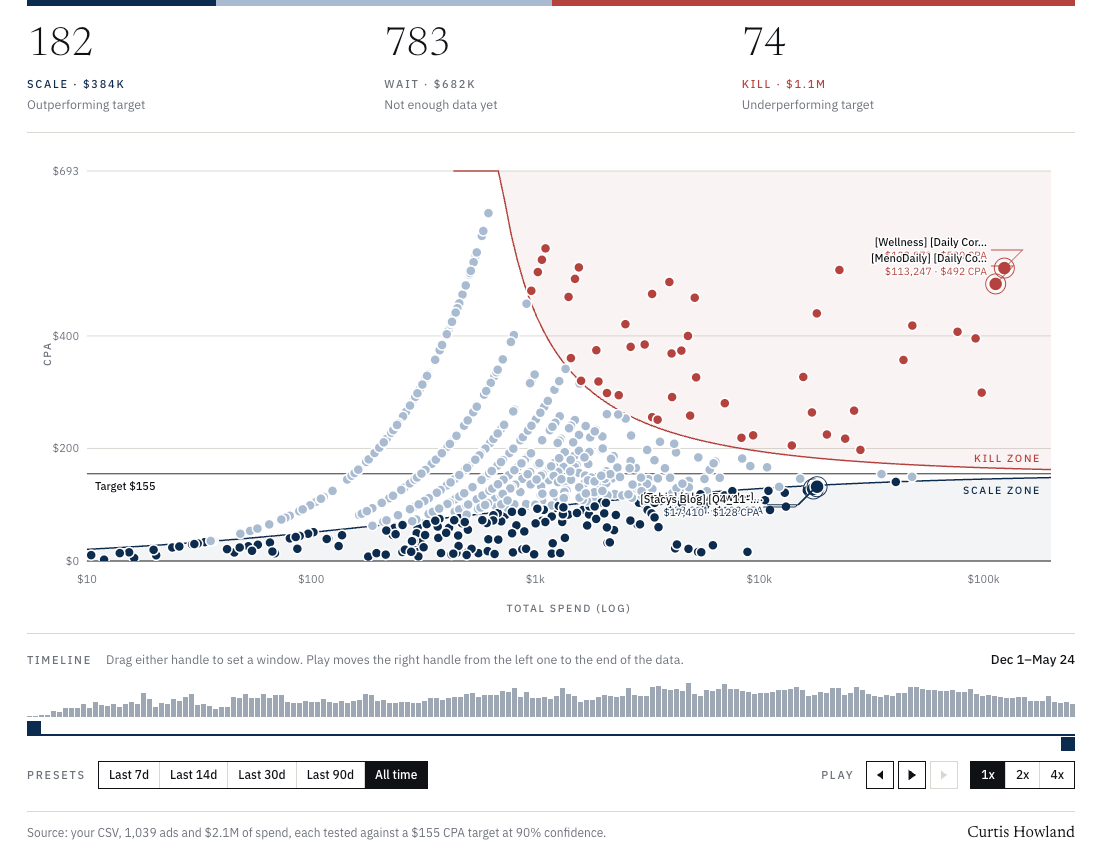
Example data in the free tool ^
Most of an account sits in the middle. That’s normal.
What isn’t normal is an ad above the cut line with real spend behind it. (Or I guess it shouldn’t be).
Backtest the Line Before You Trust It
Pull your all-time top ads.
Watch each one’s path, day by day.
Ask how often your winning ads passed through what you would have cut.
I find it very rare that this ends up cutting any top performer when using 90% confidence.
For example (Sorry the free tool doesn’t have this built, this is our internal structure)

FYI, this is an example of a poorly managed account
You need to figure out how predictive your early reads are.
The curve is a statistical model that assumes performance holds steady and the noise is random. Ads fatigue. Use it as a start and build your own thresholds from there.
70% of your creatives should be cut before week 2, and only 10-20% will ever hit your performance threshold. If you’re keeping most of your ads alive, you’re probably losing money.
An ad under target that isn’t getting spend is underscaled. Break it out and force spend, unless it’s a straight promo. The full low-spend retest is in this post.
Before You Cut, Check a Second CPA
Brought to you by Triple Whale
This is where Triple Whale comes in. They holistically support ecom digital marketing growth in many ways but most importantly (for this) they more accurately and effectively track conversion paths and can map which customers are new. They sponsored this post, but this is an important piece, so don’t skip it.
We plot every ad twice:
CPA in Ads Manager. Every purchase Meta attributes to the ad, new and returning customers.
New customer CPA in Triple Whale. First-time buyers only, on Triple Whale’s attribution.
We pull the second number from Triple Whale. Most of our clients at Misfit run on it, and we recommend it to any brand that doesn’t have an MTA yet. Triple Whale is the AI operating system built for modern commerce, so it gives us a broader view of performance beyond just attribution.
How we decide:
Plot every ad on both CPAs before cutting anything.
Over target on both: cut.
Under target on both: scale.
Meta says cut, Triple Whale says keep: keep spending and judge it on new customer CPA.
Meta says keep, Triple Whale says cut: cap the budget. It’s mostly selling to people who already bought.
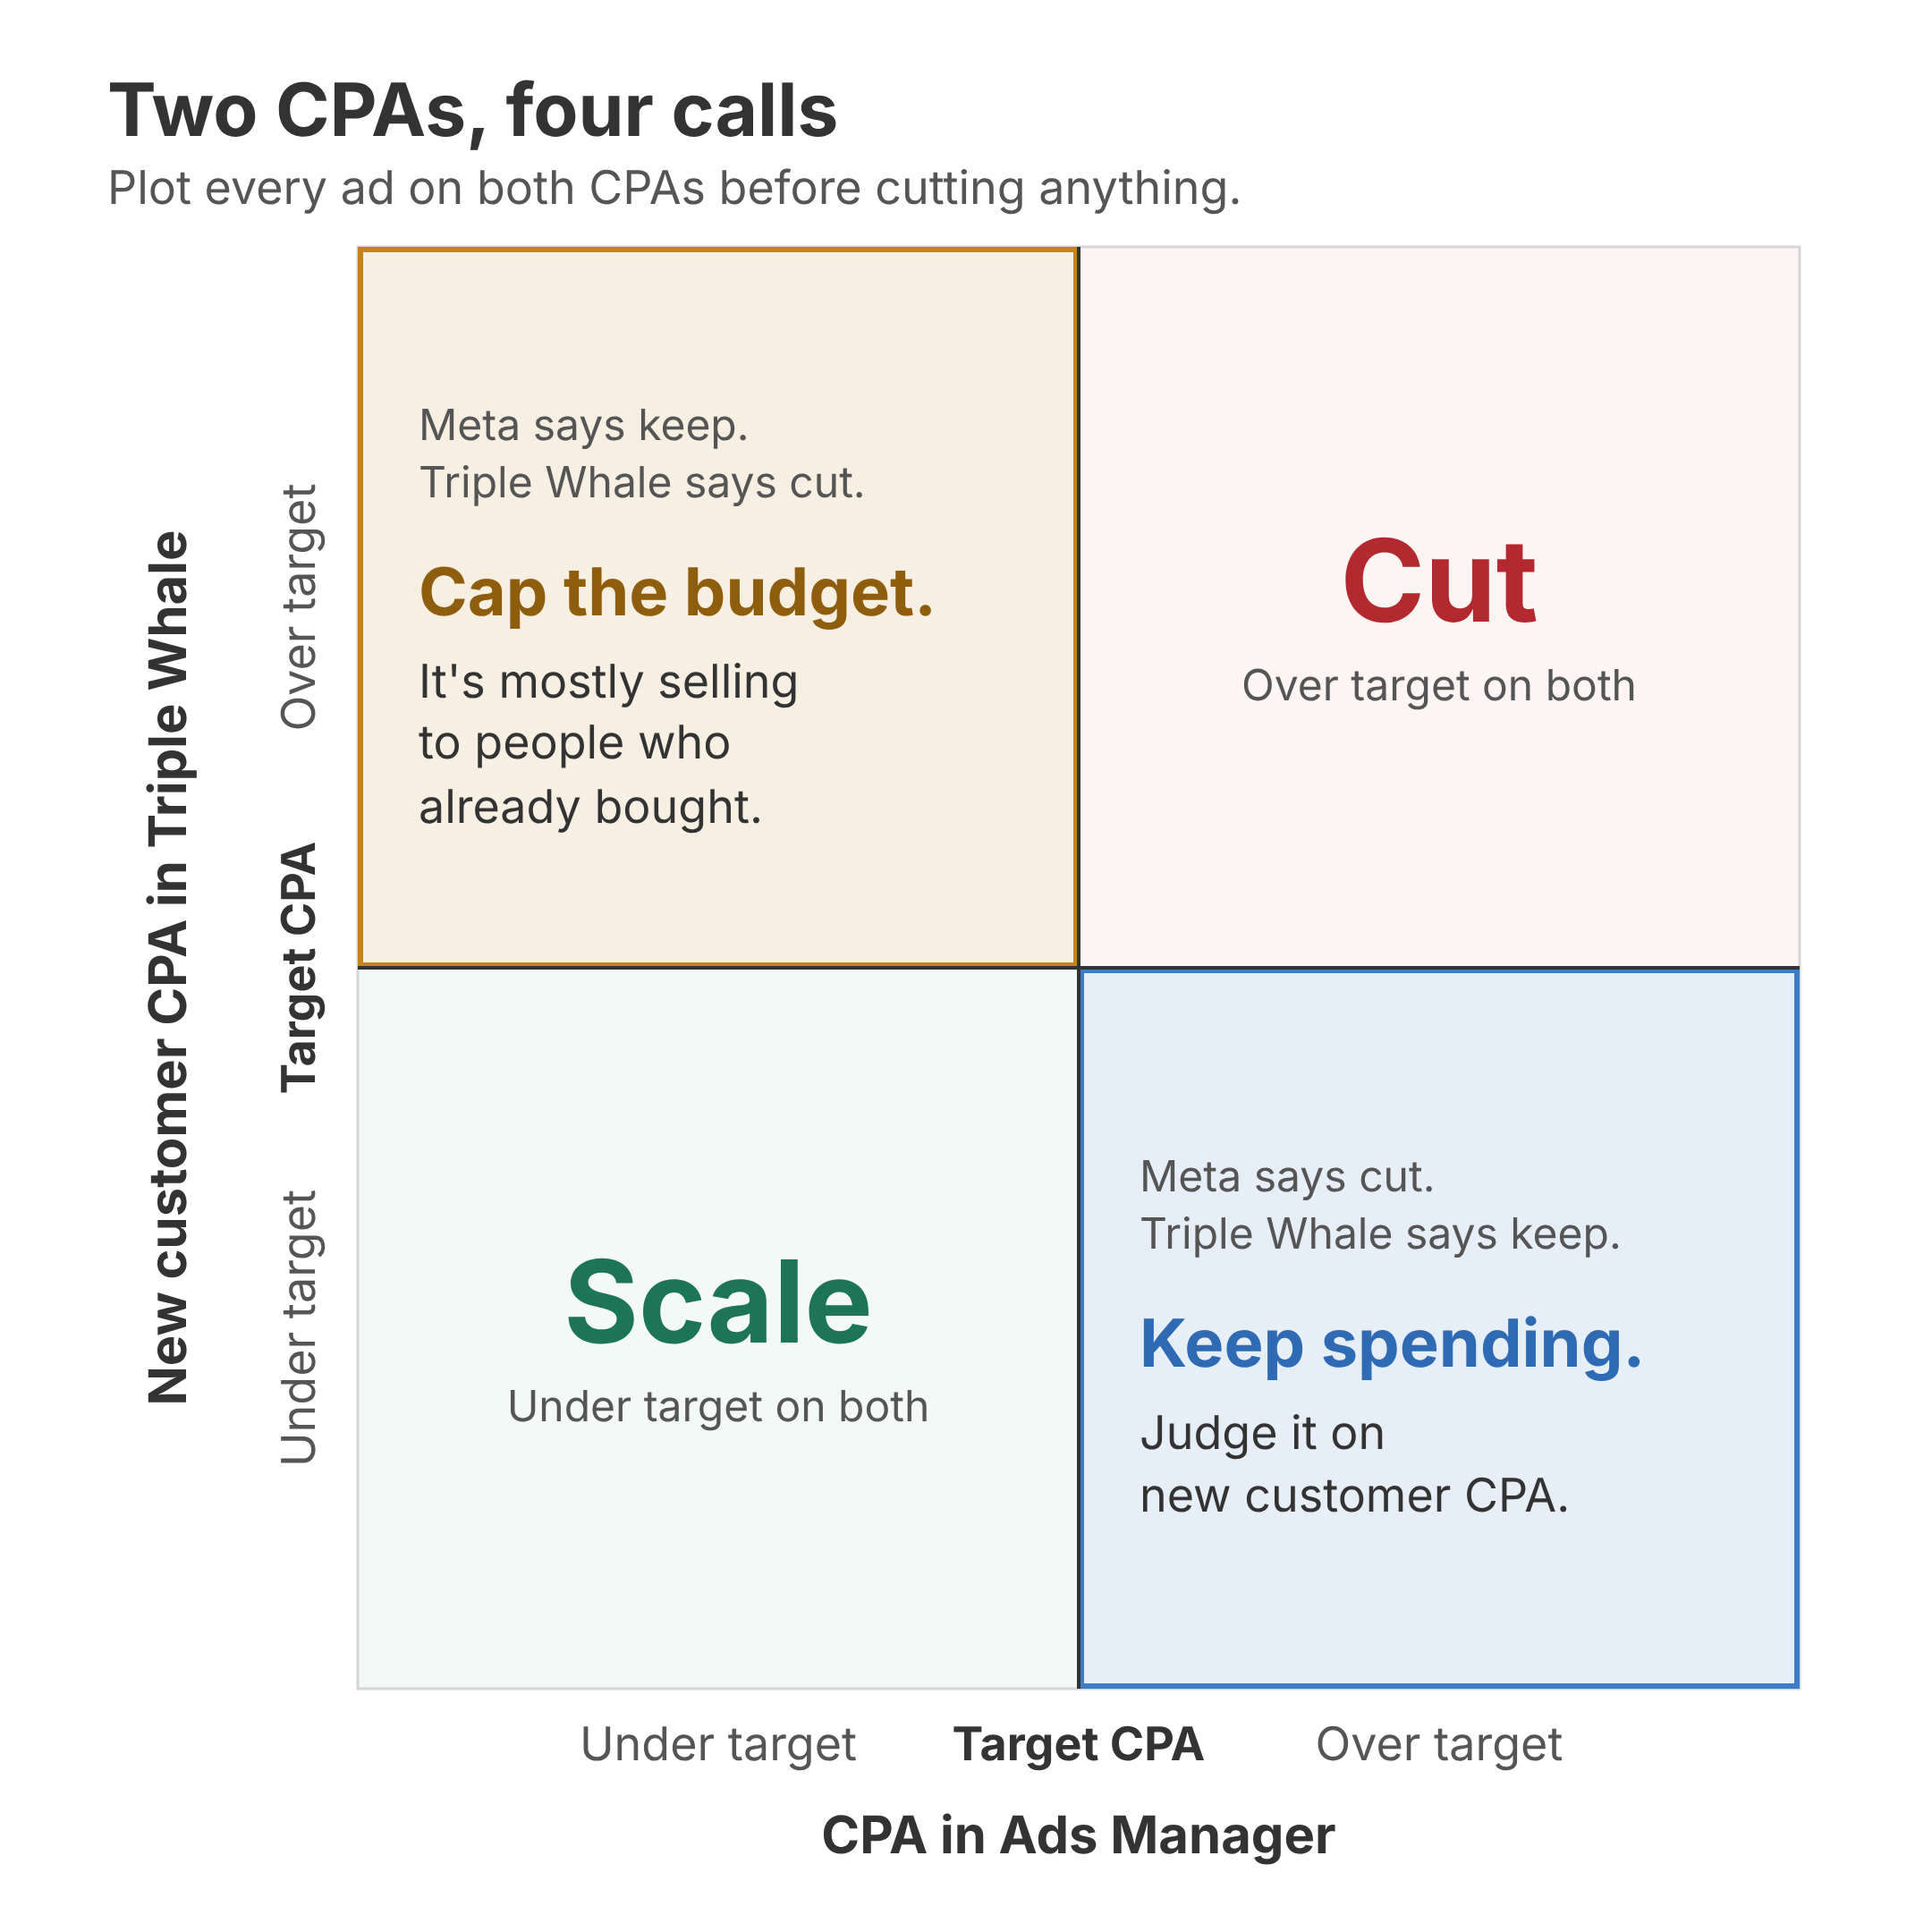
The spend rule applies to both numbers. $200 spent at an $80 CPA still means keep testing on either one.
Don't have a second CPA to check yet? Book a demo with Triple Whale.
Where an Ad Gets More Room
A client asked me a few weeks ago which metrics justify letting a top-of-funnel ad spend past target. What I look at, in order:
New customer CPA. The first step away from CPA is new customer CPA. The main reason we step away from a strong ROAS is that it’s just returning customers.
Promo or not. I’m more conservative on promos. A problem-solution ad that speaks to selling points gets a little more space.
CPMR (cost per thousand reached). If your frequency is low and your CPM is low, you have a low CPMR. You’re not reaching the same people over and over, and you’re reaching net new people cheaply.
The tail. What’s the split between 1-day, 7-day and 28-day? A longer tail with more 28-day conversions means the ad is driving awareness.
When everything points the same way, that ad gets a little more leeway. To me that’s 20-30% over the CPA target, not anything more than that.
We only run this on the top few ads that are already scaling. If an ad can’t get into the top five on decent performance, it’s not going to be the number one ad on a looser target.
A heavy promo that’s over target and still not performing gets cut more aggressively.
Check Last Year Before You Draw This Year’s Line (Black Friday is coming)
Step 1: pull last year’s Q4 data using Triple Whale’s BFCM Command Center.
Compare 1-day click to 28-day click.
Calculate the % lift week by week.
Find when latent demand peaks.
Step 2: set targets by period.
Pre-BFCM: run at 2.5x, knowing it matures to 4x.
BFCM weekend: expect incremental at 2-3x.
Post-BFCM: normal efficiency targets.
You want to do this if you have a long purchase cycle. You don’t if it’s an impulse buy.
There are plenty of people waiting around right now, ready to buy on Black Friday and being influenced by ads now. You need to adjust your targets to account for that, but also don’t be naive and make sure you base it on last year’s data.
Curtis
Cutting on the right number rather than simply cutting fast is the distinction most accounts miss. The backtest is the part I'd make everyone do, since checking whether your own winners would have survived your rules is the quickest way to find out if the rules are any good. Hopkins tested ad against ad for much the same reason. An opinion about an ad only counts once the data has had a fair chance to disagree with it.
The spend-scaled cut line is the right frame, and the scatter plot makes it operational. One thing worth adding: CPA on the Y-axis hides the ads that spend slowly but convert later, so the log-scale spend axis helps but the cut still punishes an ad for a timing gap rather than a quality gap. With BFCM five weeks out I'd rather keep a slow starter that clears target on assisted conversions than cut it and re-learn the lesson in November.
The other trap is cutting on platform CPA when the store's own numbers disagree. If the cut decision comes from a number that can't be reconciled with real orders, you're pruning on noise.