

I manage millions in monthly Meta ad spend in the DTC space.
And one of the first things I do with every new client is audit their attribution setup.
Here’s what I usually find: they’re tracking everything and measuring nothing.
Meta says they drove 500 conversions. Google says they drove 400. TikTok claims 150. That’s 1,050 “attributed” conversions for a brand that actually had 600 orders.
Every platform is grading its own homework. And every platform gives itself an A+.
The brands have an MMM nobody uses and a post purchase survey they don’t use to calibrate spend.
So they make budget decisions based on bad data. They over-invest in whatever platform tells the prettiest story. They under-invest in channels that actually drive awareness but don’t get the last click. And they wonder why scaling spend doesn’t scale revenue.
Maybe they set up a MTA tool and think that its accurate since its ‘impartial’
Or they use an ‘AI Model for attribution that aggregates all signals’…. I hate black boxes for attribution…
Attribution isn’t broken because there’s no data. There’s too much data and not enough understanding.
So here are the 8 attribution models every DTC brand should know, how they fit together, and which 3 I actually use to manage $30M+ a year in ad spend.
The Christmas Tree Framework
Before I walk through the 8 models, you need to understand how they fit together. The biggest mistake I see is brands trying to solve attribution at the wrong level.
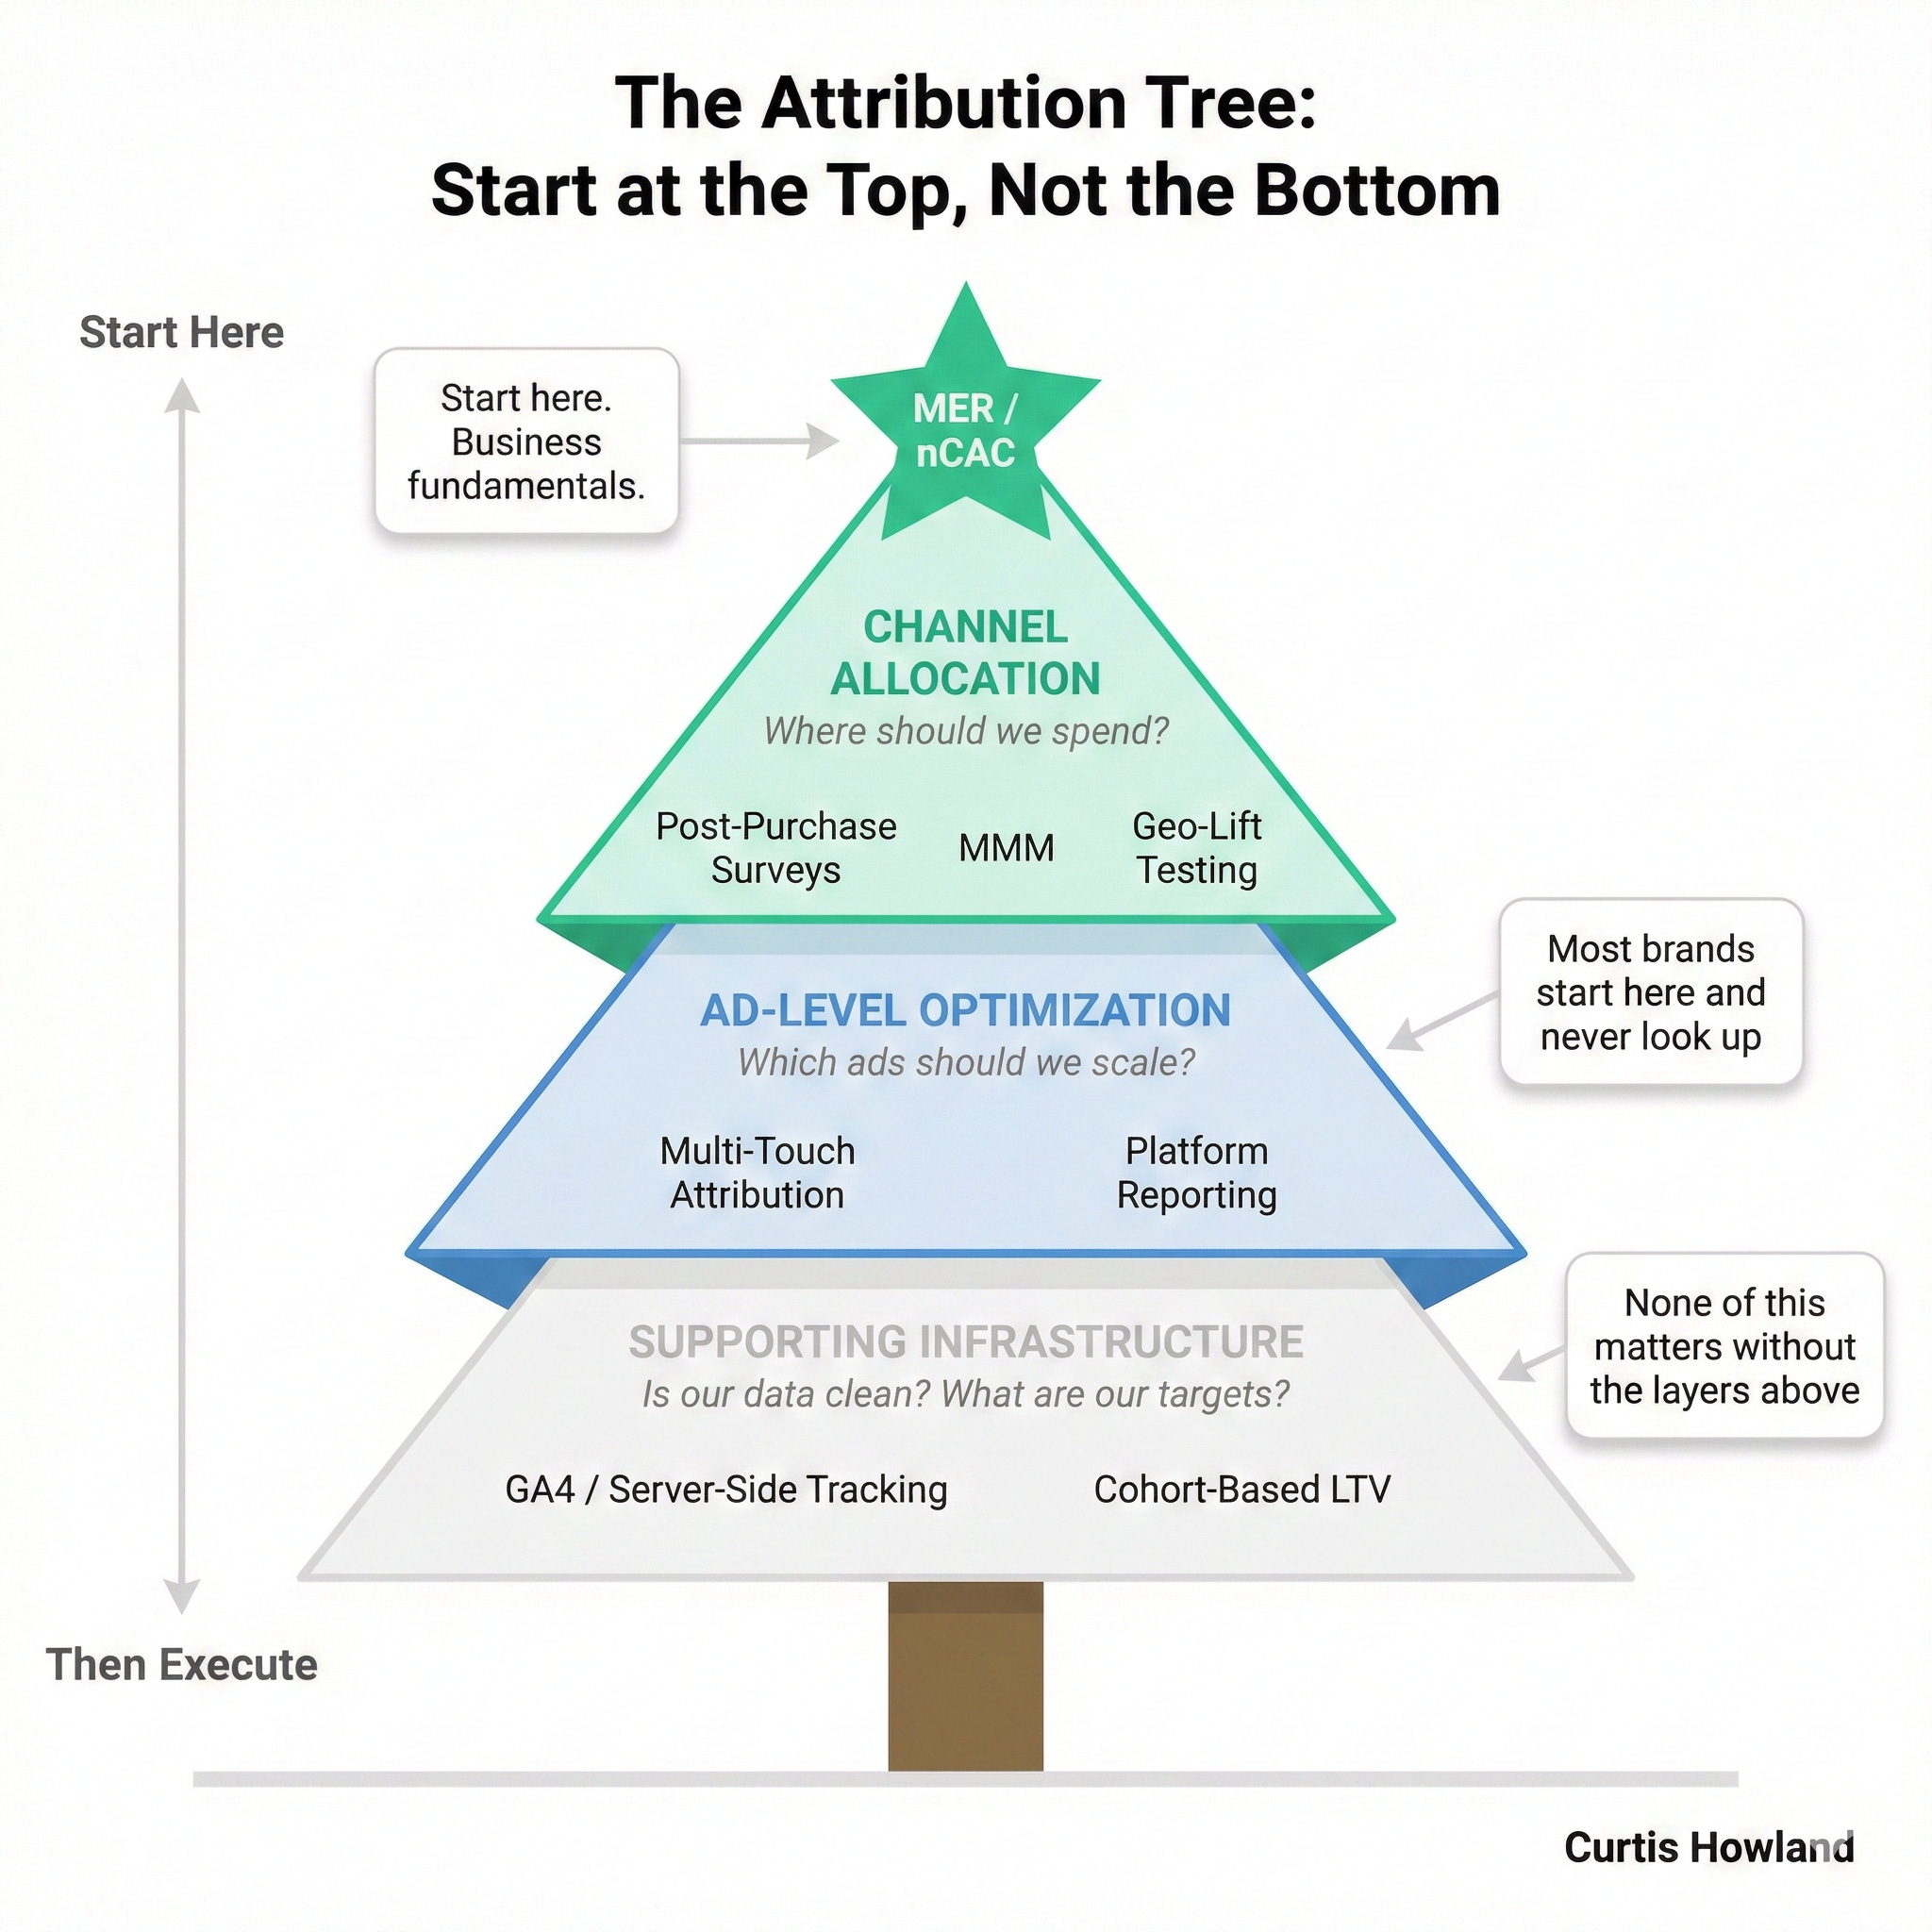
Think of attribution like a Christmas tree. (Pyramid / la tour Eiffel / any triangle)
At the very top is the star: your blended target. This is your MER (Marketing Efficiency Ratio) or nCAC (New Customer Acquisition Cost). It’s channel-agnostic. It tells you if the business is working, but not why.
Simple: How many new customers did you get? How much revenue? How much did you spend on marketing.
Accurate to the decimal & decides how much you should spend.
The upper branches are your channel allocation tools. Post-purchase surveys, Marketing Mix Models, and incrementality testing live here. They answer: which channels should I be spending more on? Which are actually driving results?
The lower branches are your campaign and ad-level tools. Multi-touch attribution (Triple Whale, Northbeam) and platform-reported data live here. They answer: which ads should I scale? Which should I cut?
The trunk is your supporting infrastructure. GA4, server-side tracking, CAPI setup. These don’t measure attribution directly. They make all your other tools more accurate.
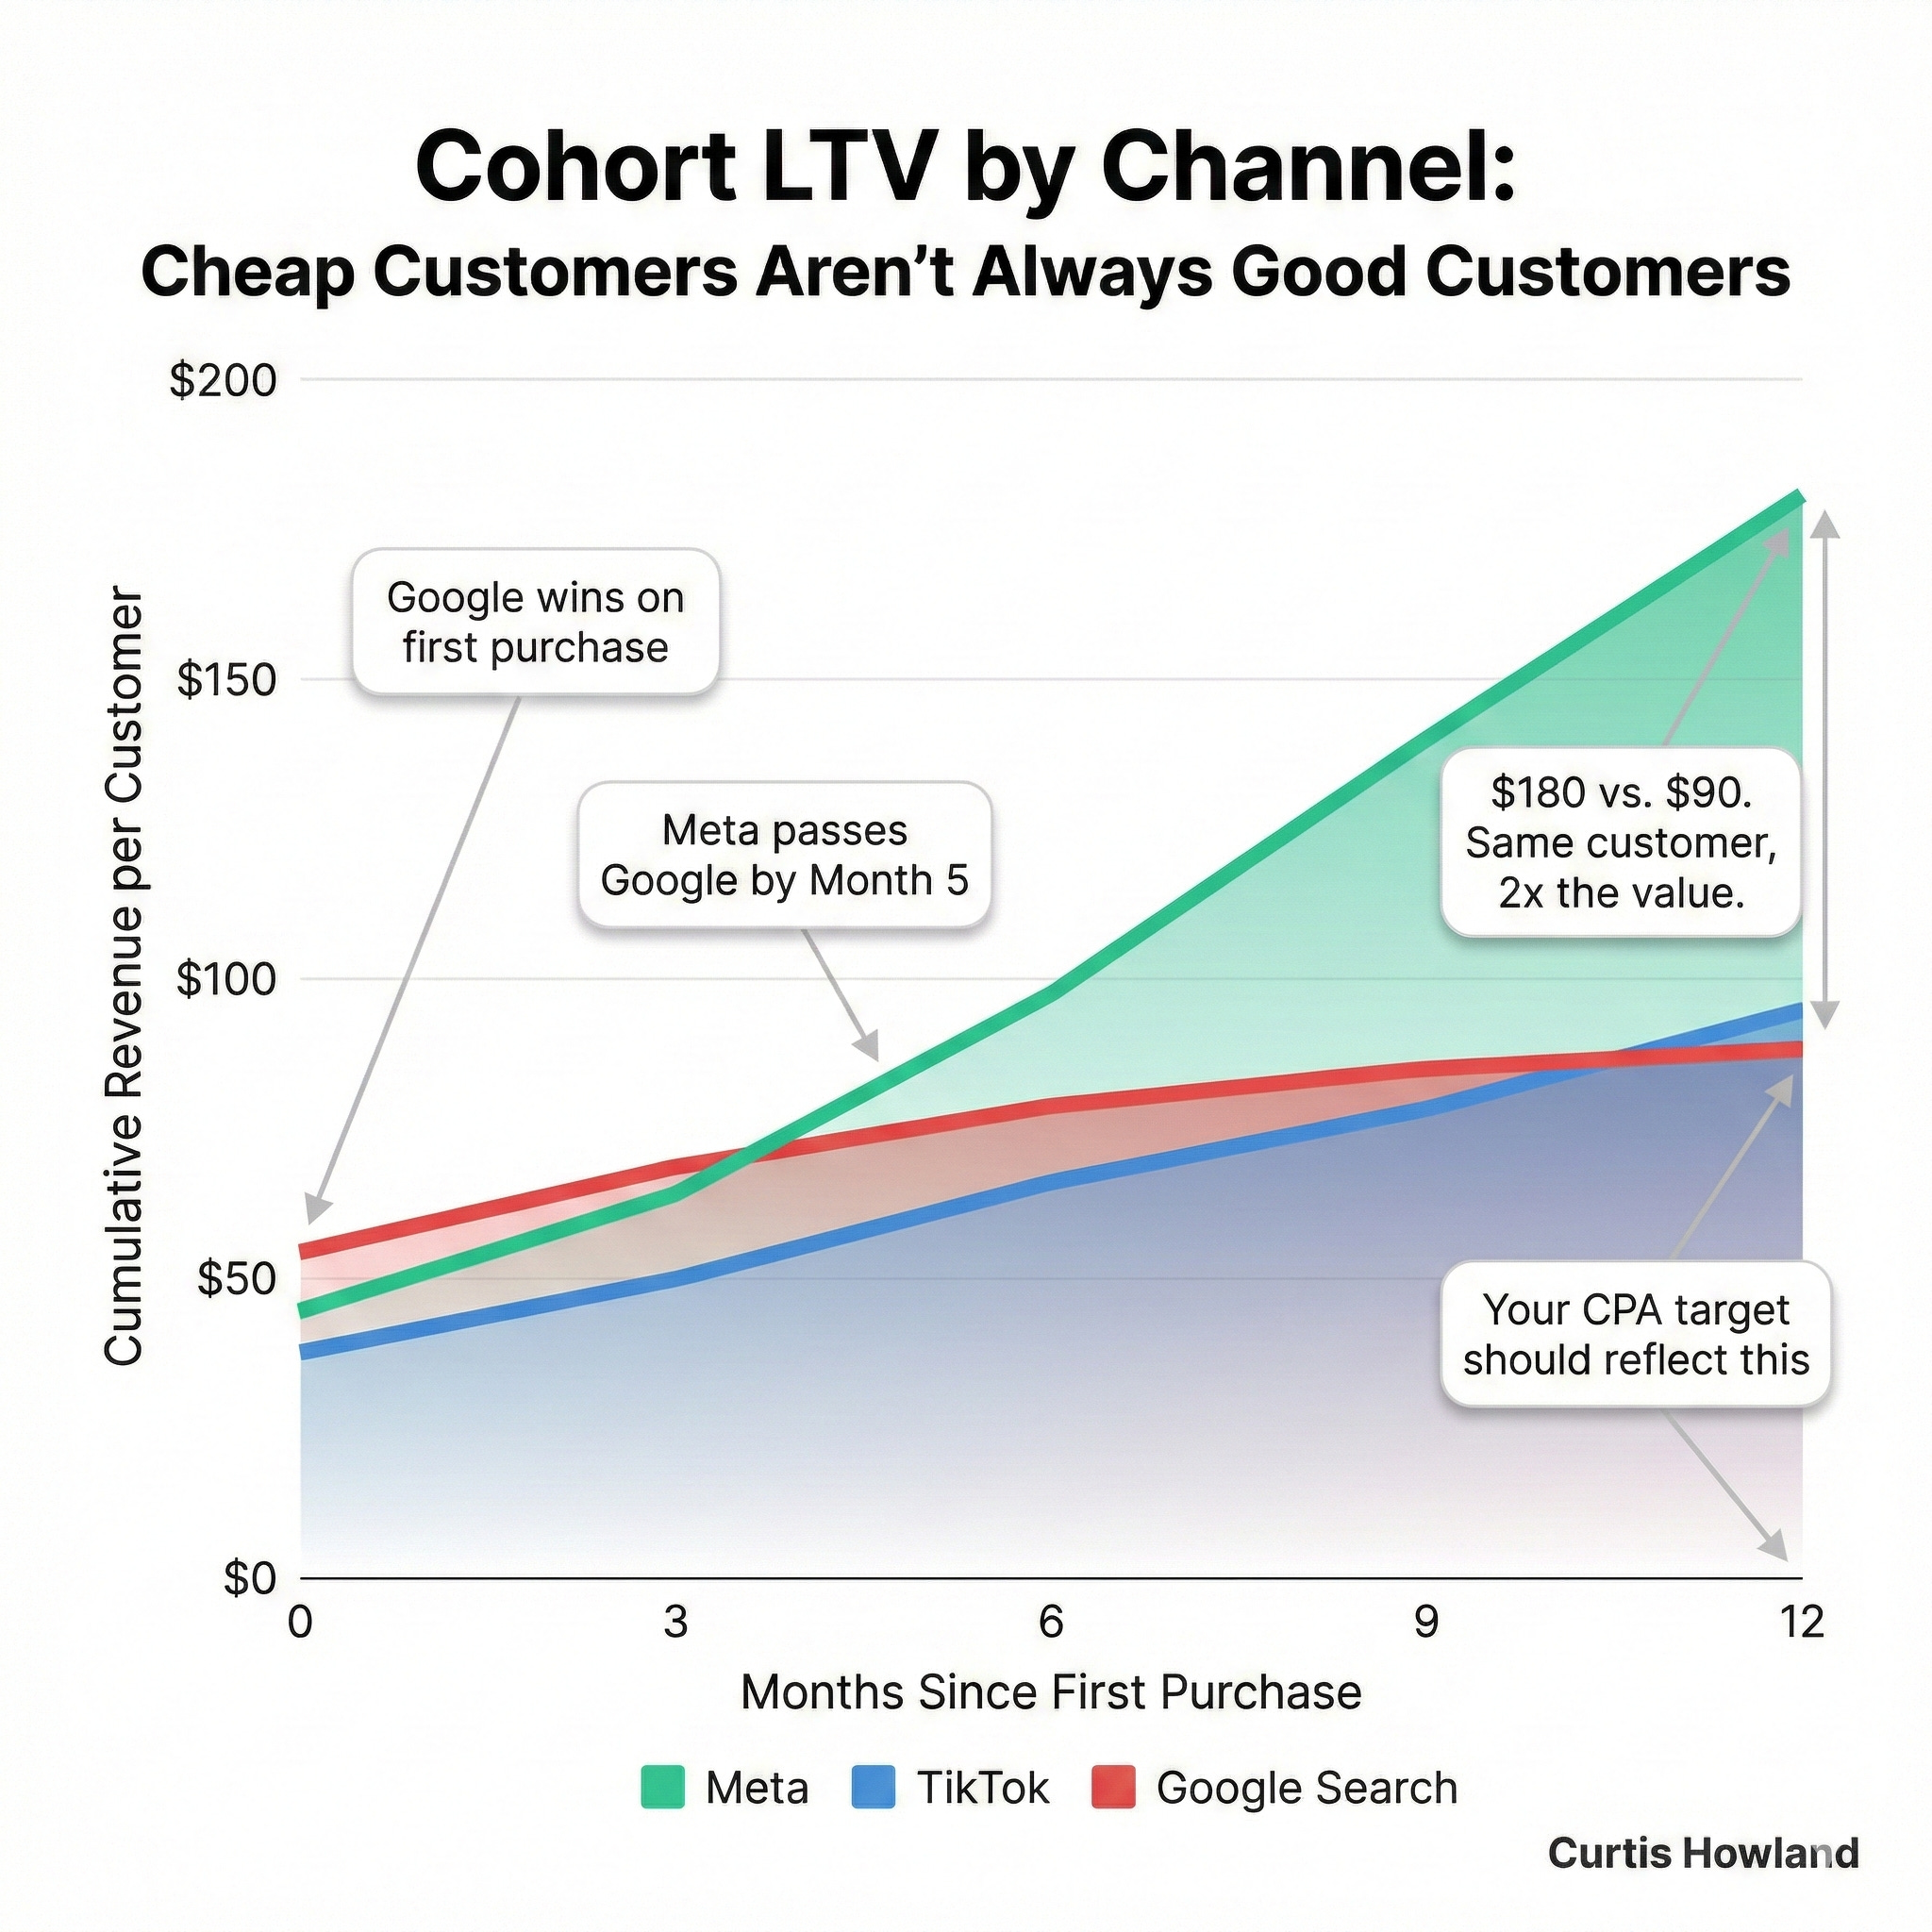
And the roots, feeding everything, is cohort-based LTV attribution. This is how you nuance your targets in the first place. If Meta customers have 2.5x LTV versus TikTok customers at 1.8x, your CPA targets should adjust to relfect that.
Here’s why this hierarchy matters:
Most brands try to solve attribution from the bottom up. They install an AI-powered attribution tool and try to perfectly track every individual customer’s journey. They get precise numbers that feel scientific.
But precision is not accuracy.
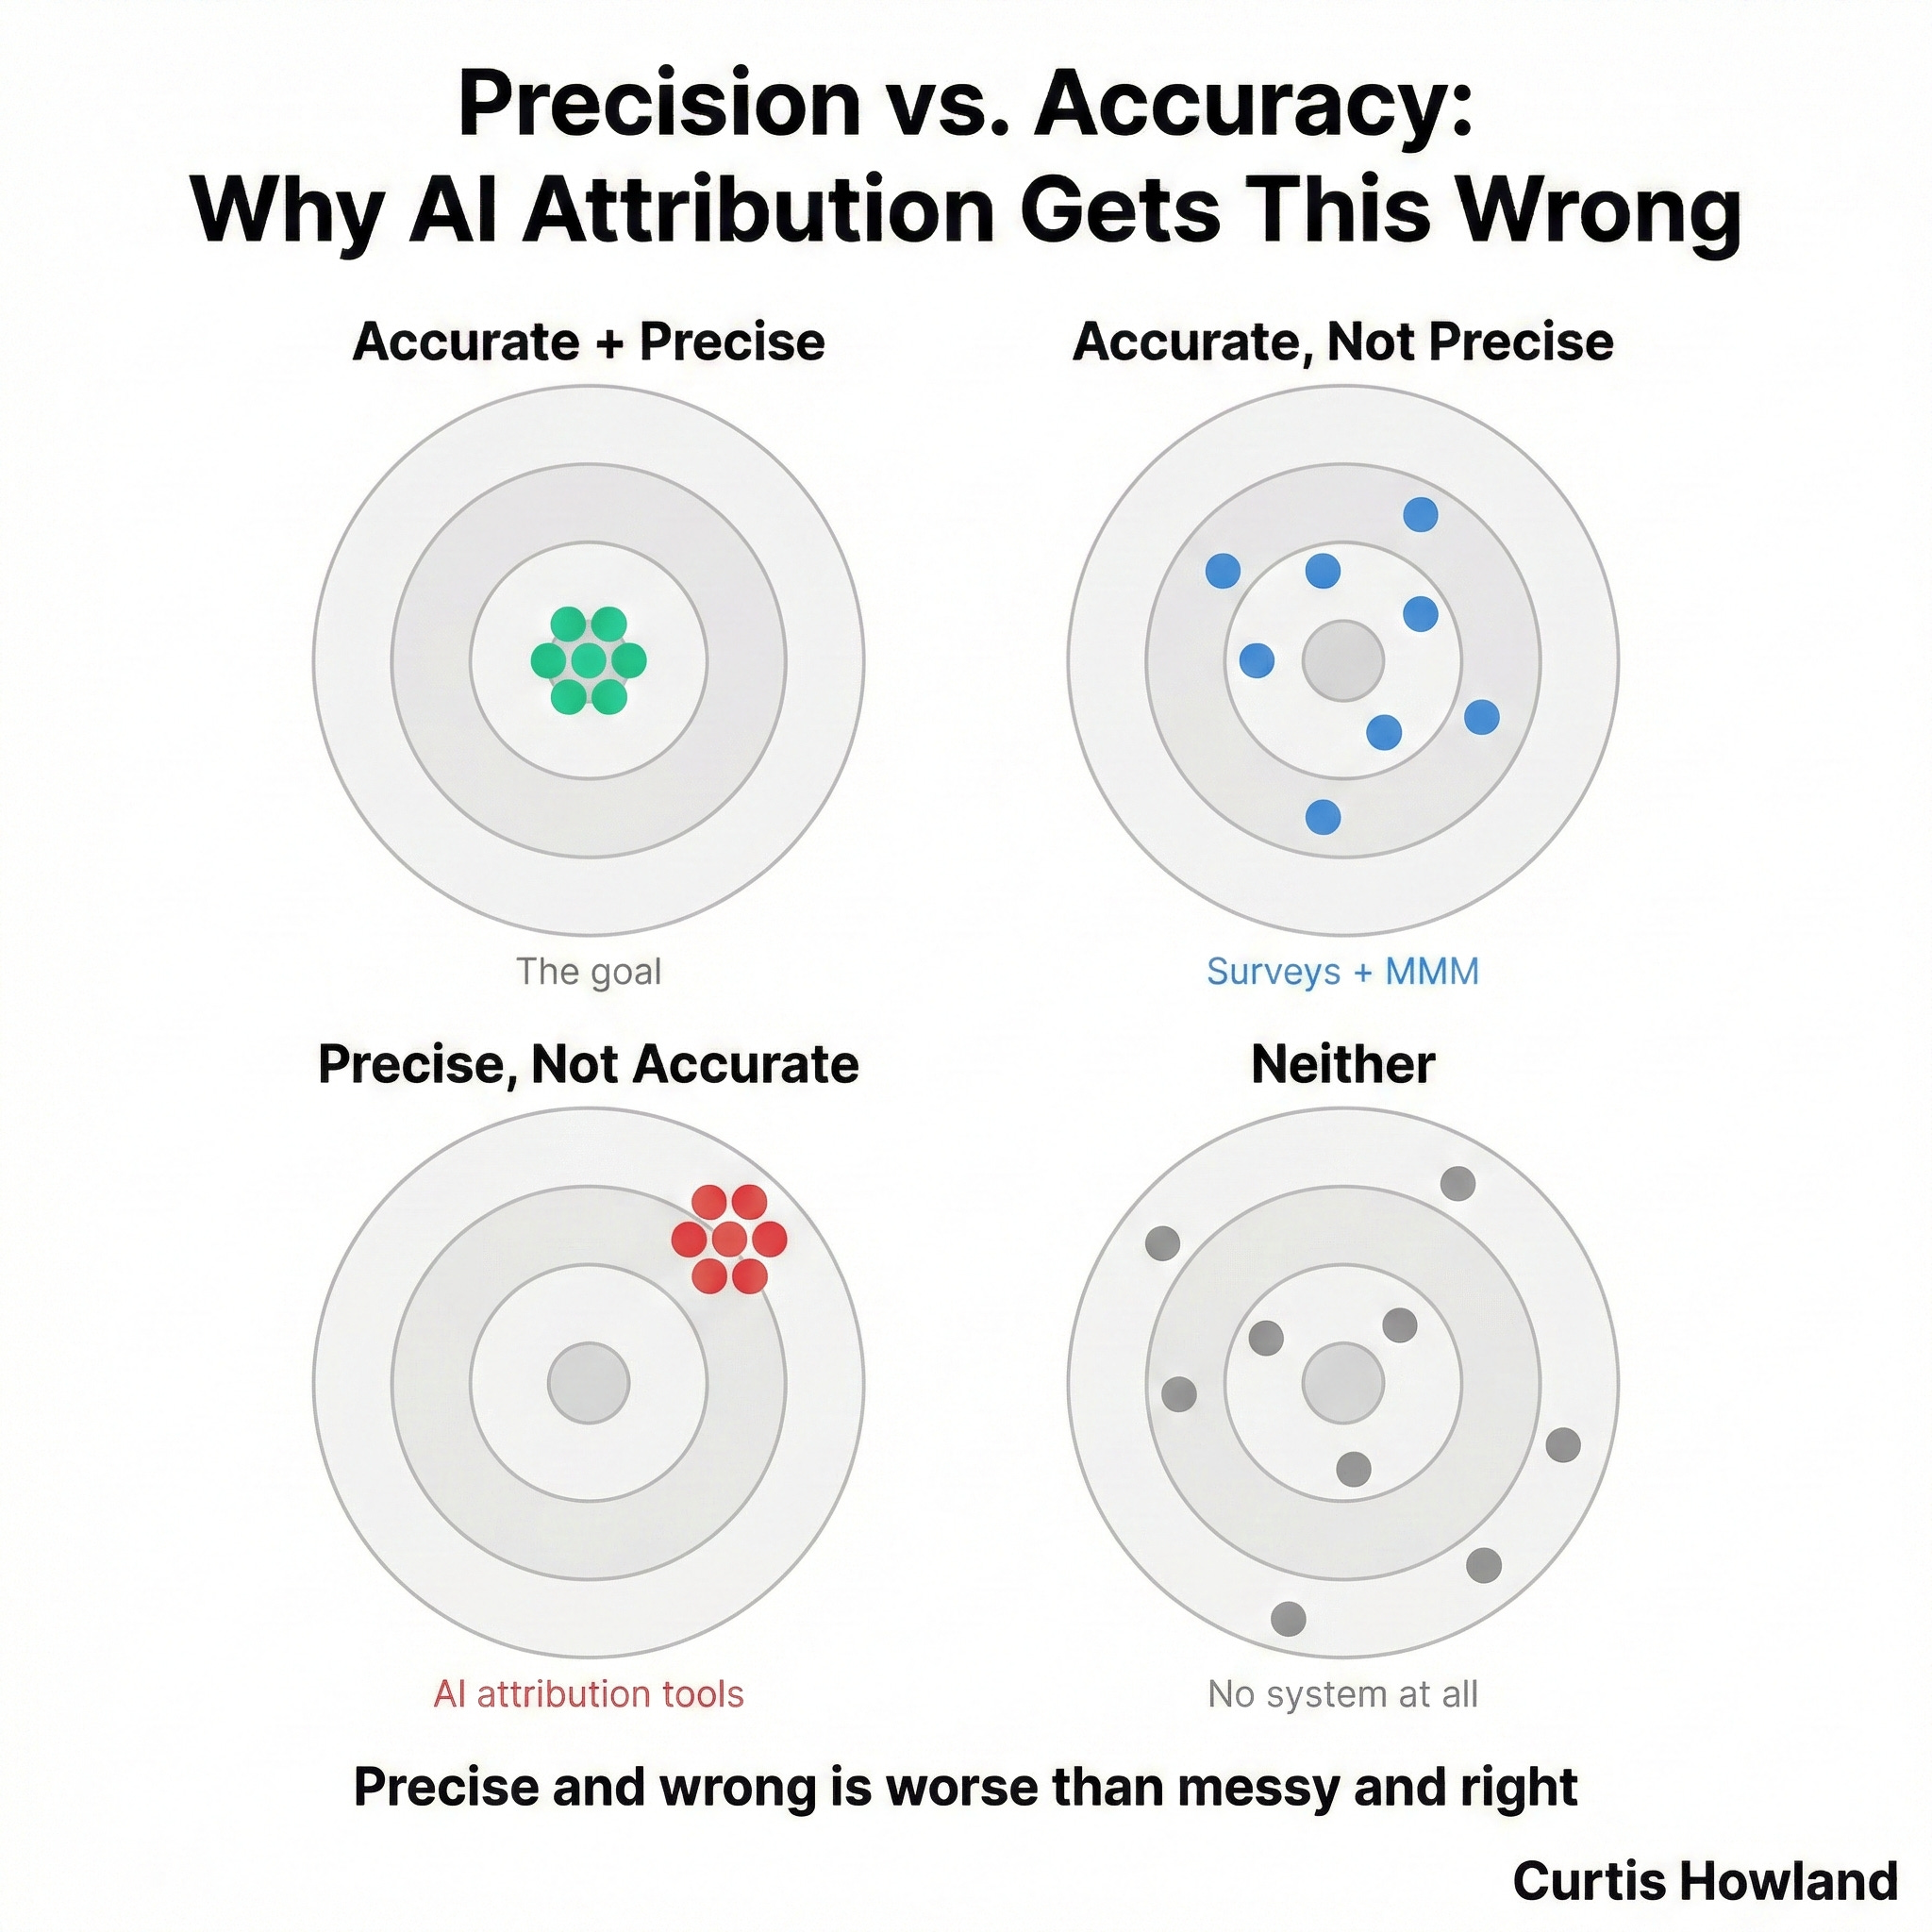
if you start in the middle of the Christmas tree, you end up with the bottom left. Precise but not accurate attribution
so instead you need to start at the top and then layer in surveys and MMM so that you’re accurate. Although you don’t get precision from that
And only then can you layer in MTAs to get precision within that accuracy
Top down. That’s the framework.
Now let’s walk through all 8.
Layer 1: The Star. Blended Metrics
Model 1: MER and nCAC
What it is: Total marketing spend divided by total revenue (MER), or total marketing spend divided by total new customers (nCAC). No channel breakdown. No platform data. Just business-level math.
When to use it: Always. This is your north star. Every single day.
Why it matters: MER and nCAC are the only metrics that can’t lie to you. Every platform will inflate its own numbers. But your bank account doesn’t. When Meta says ROAS is 4x and your P&L says you lost money, your P&L is right.
Here’s a quick example of why this matters:
A brand comes to me with a 4.2x ROAS on Meta. Looks amazing. But when I pull the full picture, their MER tells a different story. They had a 35% new customer ratio (meaning 65% of “conversions” were returning customers who probably would have bought anyway), their COGS were 48%, and platform fees ate another 8%. That 4.2x ROAS actually translated to a loss of $15k that month.
Compare that to another brand at 2.8x ROAS with a much better new customer mix and tighter COGS. They made $45k profit.
MER shows it. ROAS didn’t.
Limitation: Tells you IF something is working, not WHAT is working. You can’t make channel decisions from MER alone. It’s the star on the tree, not the whole tree.
The key numbers:
Your maximum marketing spend = Gross Margin % – OpEx %. Cross this line and you’re losing money at the company level.
Your target CPA = projected 3-month customer profitability. This is your efficient growth zone.
Everything else in this post is about figuring out how to spend between those two numbers as effectively as possible.
Layer 2: The Upper Branches. Channel Allocation
This is where most brands fail. They skip this layer entirely and jump straight to ad-level optimization. But you can’t optimize ads if you’re spending on the wrong channels.
Model 2: Post-Purchase Surveys
What it is: A survey on your order confirmation page asking: “Where did you FIRST hear about us?”
When to use it: Every single day. This is one of my favorite attribution tools in all of DTC.
Why it’s powerful:
Post-purchase surveys measure something fundamentally different from click-based attribution. They measure what’s memorable.
Think about that. An ad has to be remembered to be impactful. If someone can recall that they first discovered you through a TikTok ad, that ad did its job. It created awareness. It built the mental association. The fact that they eventually Googled your brand name and clicked a search ad to buy doesn’t matter. The search ad didn’t create the demand. It captured it. Thats not scalable.
Click-based attribution overvalues lower-funnel performance by as much as 250%+. I’ve seen it across dozens of accounts. Google Search always looks like a hero in click-based models because it’s the last stop before purchase. But it’s rarely the first touch.
Post-purchase surveys catch what click attribution misses. We’ve seen cases where top-of-funnel creative on Meta drove 13x more incremental acquisitions than bottom-of-funnel creative. Click attribution told us the exact opposite story.
How to set it up:
Add a post-purchase survey to your Shopify checkout. The question: “Where did you FIRST hear about us?”
Options should include every channel you spend money on (Facebook/Instagram, TikTok, Google Search, YouTube, Podcast, Friend/Referral, etc.), plus “Other” with a text field. Keep it under 10 options. Randomize the order.
Target a 35%+ response rate. Extrapolate to all new customers. Then calculate your cost per new customer response per channel.
This tells you where to push budget at the channel level.
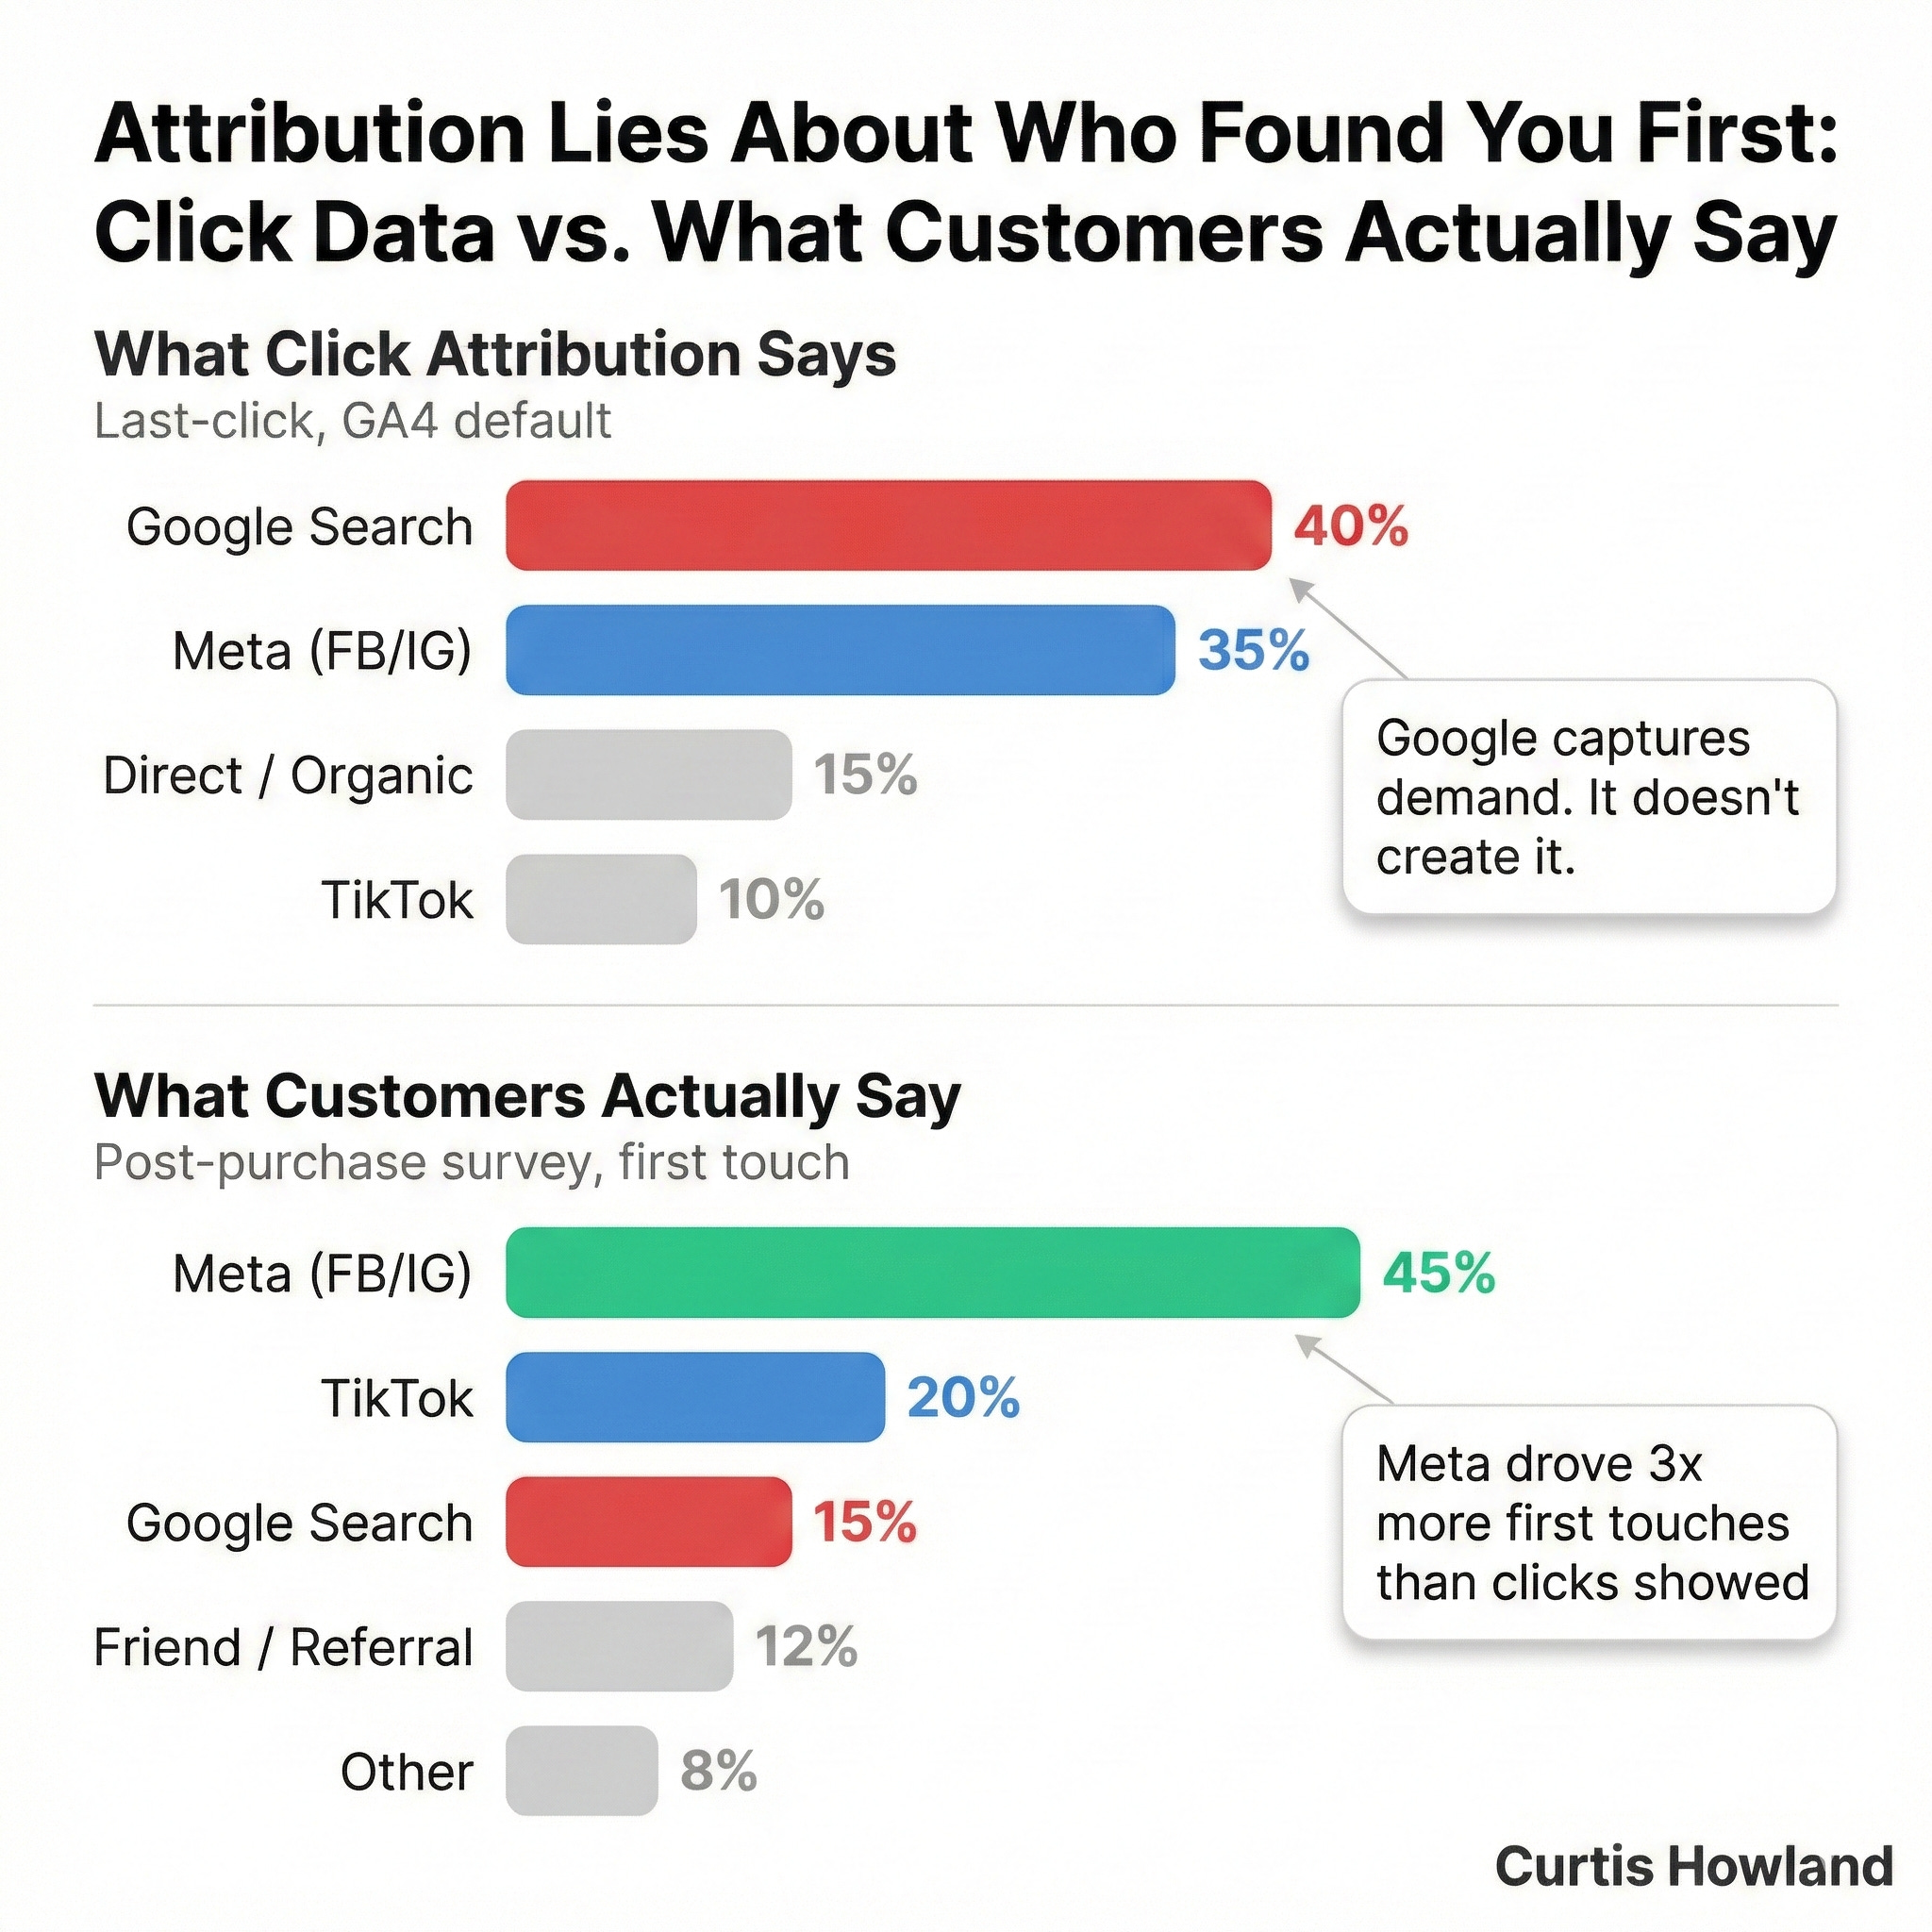
Limitation: People don’t always remember correctly. Long purchase cycles make this harder. And if someone saw 10 Meta ads over 3 months, they might just say “Instagram” without knowing which specific campaign drove them. That’s fine. You’re measuring at the channel level here, not the ad level.
The other limitation is that it’s self-reported, so you’ll see some channels consistently under- or over-report. That’s where MMM comes in to validate.
Model 3: Marketing Mix Modeling (MMM)
What it is: A statistical approach that uses aggregate historical data (spend by channel, revenue, seasonality, external factors) to estimate each channel’s contribution to sales. No user-level tracking required.
When to use it: Monthly or quarterly for directional validation. Not daily.
Why it’s powerful:
MMM doesn’t rely on cookies, clicks, or any user-level tracking. It’s completely privacy-safe. It looks at the relationship between your spending patterns and your revenue patterns over time, accounting for things like seasonality, promotions, and external factors.
Where post-purchase surveys tell you what customers remember, MMM tells you what the data says is driving revenue regardless of what customers recall.
The two work together beautifully. You can use MMM to validate that your post-purchase survey is sending you in the right direction. And you can use post-purchase survey data to calibrate your MMM.
If your post-purchase survey says “push more into TikTok” and your MMM agrees, you have high confidence. If they disagree, you dig deeper before making a big budget move.
The landscape:
MMM has had a massive resurgence in the last few years. Meta released Robyn (open-source), Google released Meridian (open-source), and there are SaaS options like Measured, Sellforte, and others that make it more accessible.
Robyn is popular and powerful if you have data science resources. It uses Meta’s Nevergrad optimization library and can incorporate experiment results to calibrate the model.
One of the biggest benefits of an MMM is that you can measure the marginal performance of a channel to know just not the holistic performance, but where you are in the bend, which can be very valuable to deciding where to put the next dollar, not based on the average performance, but based on the marginal performance
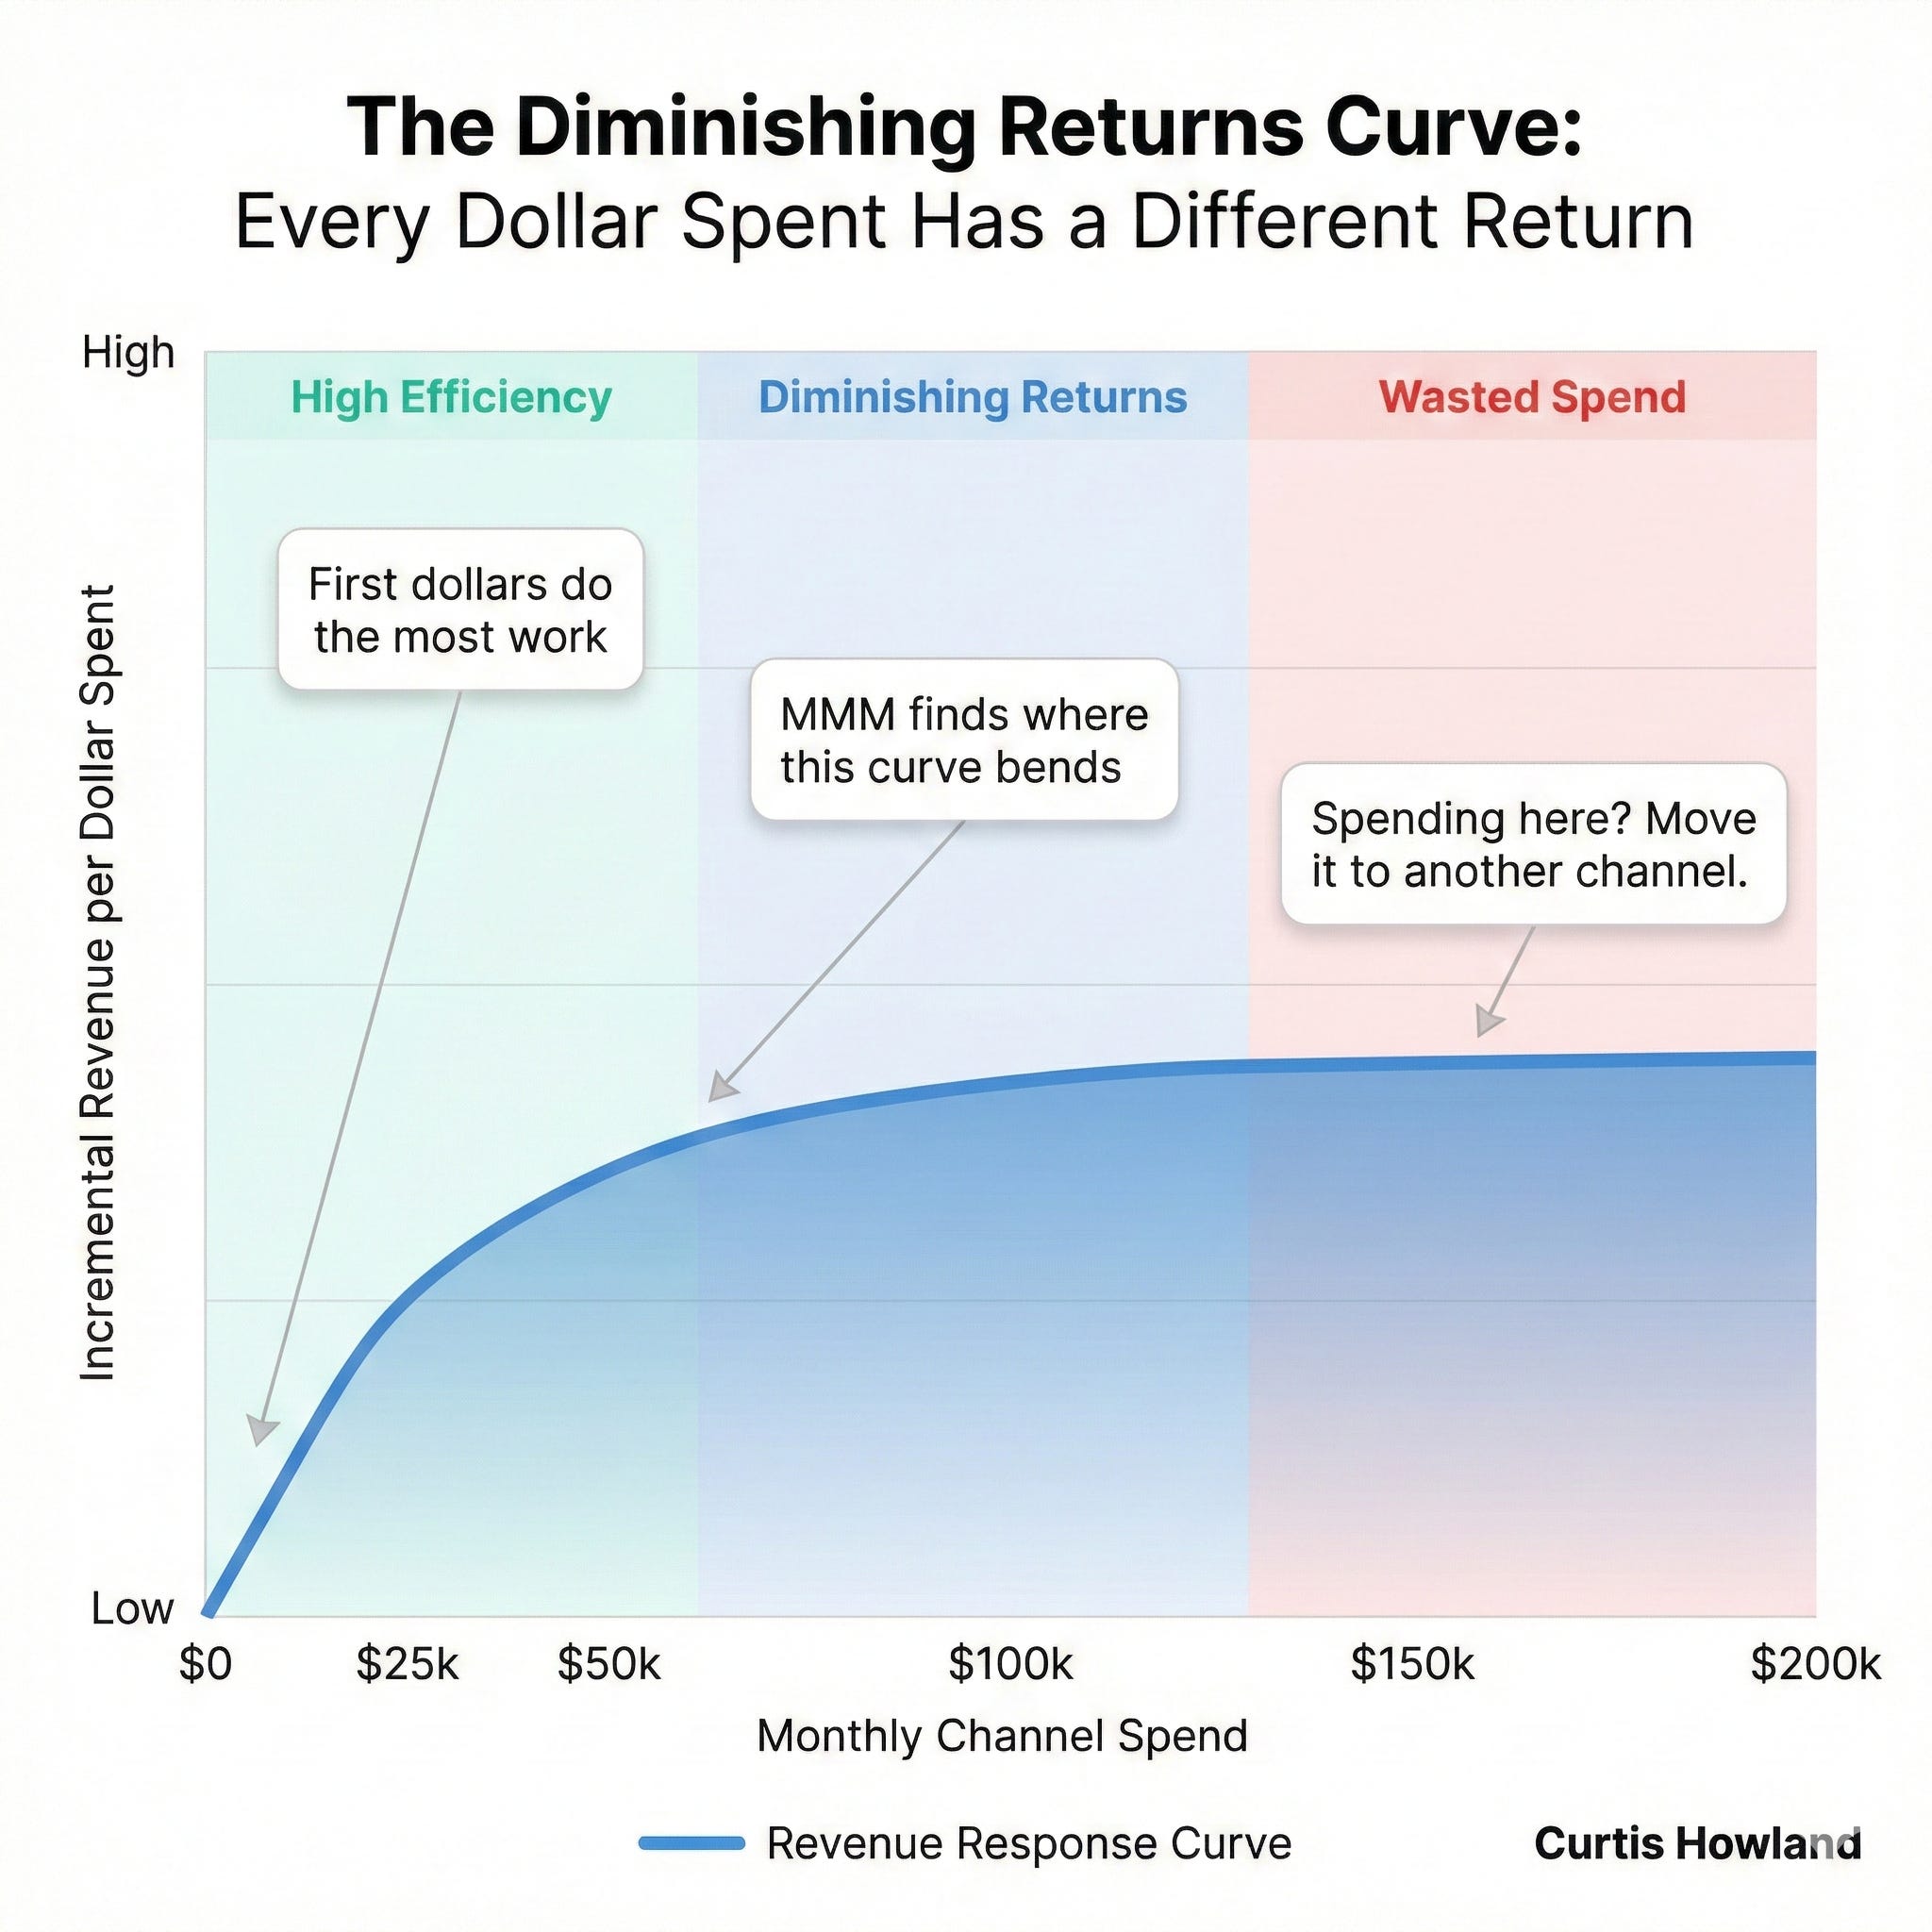
But I generally don’t recommend jumping into MMM as your first move. You need scale for the data to be meaningful (typically $500k+ per year in ad spend minimum), and you need clean historical data across channels.
Limitation: MMM is a model. It’s not ground truth. It gives you directional guidance, not surgical precision. It requires sufficient data history (ideally 2+ years of weekly data). And the outputs need interpretation by someone who understands both the math and the business context.
It also requires careful set up. If you have messy data or plan to just wing it for a quick check, probably best to skip the MMM. Might do more harm than good.
Some channels drive low-quality customers that look good on ROAS but don’t stick around. MMM helps you optimize for 12-month profit as opposed to just immediate return.
Model 4: Incrementality / Geo-Lift Testing
What it is: Controlled experiments where you turn marketing on or off in specific geographic regions and measure the difference in sales between test and control groups.
When to use it: Quarterly (or whenever you need to validate a specific strategic question).
Why it’s powerful:
This is the closest thing to scientific proof in marketing. Full stop.
You’re not modeling. You’re not surveying. You’re running an actual experiment. “What happens to sales in Dallas when we turn off Meta retargeting for 4 weeks while keeping it on in Houston?”
If Dallas sees no meaningful drop in sales, your retargeting isn’t as incremental as Meta’s dashboard claims. If it drops significantly, it’s working and you have a real iROAS (incremental ROAS) number you can trust.
This is really valuable for answering the questions that other attribution models can’t:
Is our retargeting actually driving sales, or just claiming credit for people who would have bought anyway?
How much incremental revenue does YouTube actually drive (beyond what click attribution captures)?
Would we lose anything if we cut our branded search spend by 50%?
Is this new channel (AppLovin, CTV, etc.) actually worth the investment?
Tools: Haus is gaining popularity with DTC brands and makes it relatively easy to design and run geo-lift tests. Stella offers a self-serve platform. Meta and Google both have their own Conversion Lift Study tools within their platforms (though those are limited to measuring their own channels, which introduces some bias). TikTok has one too.
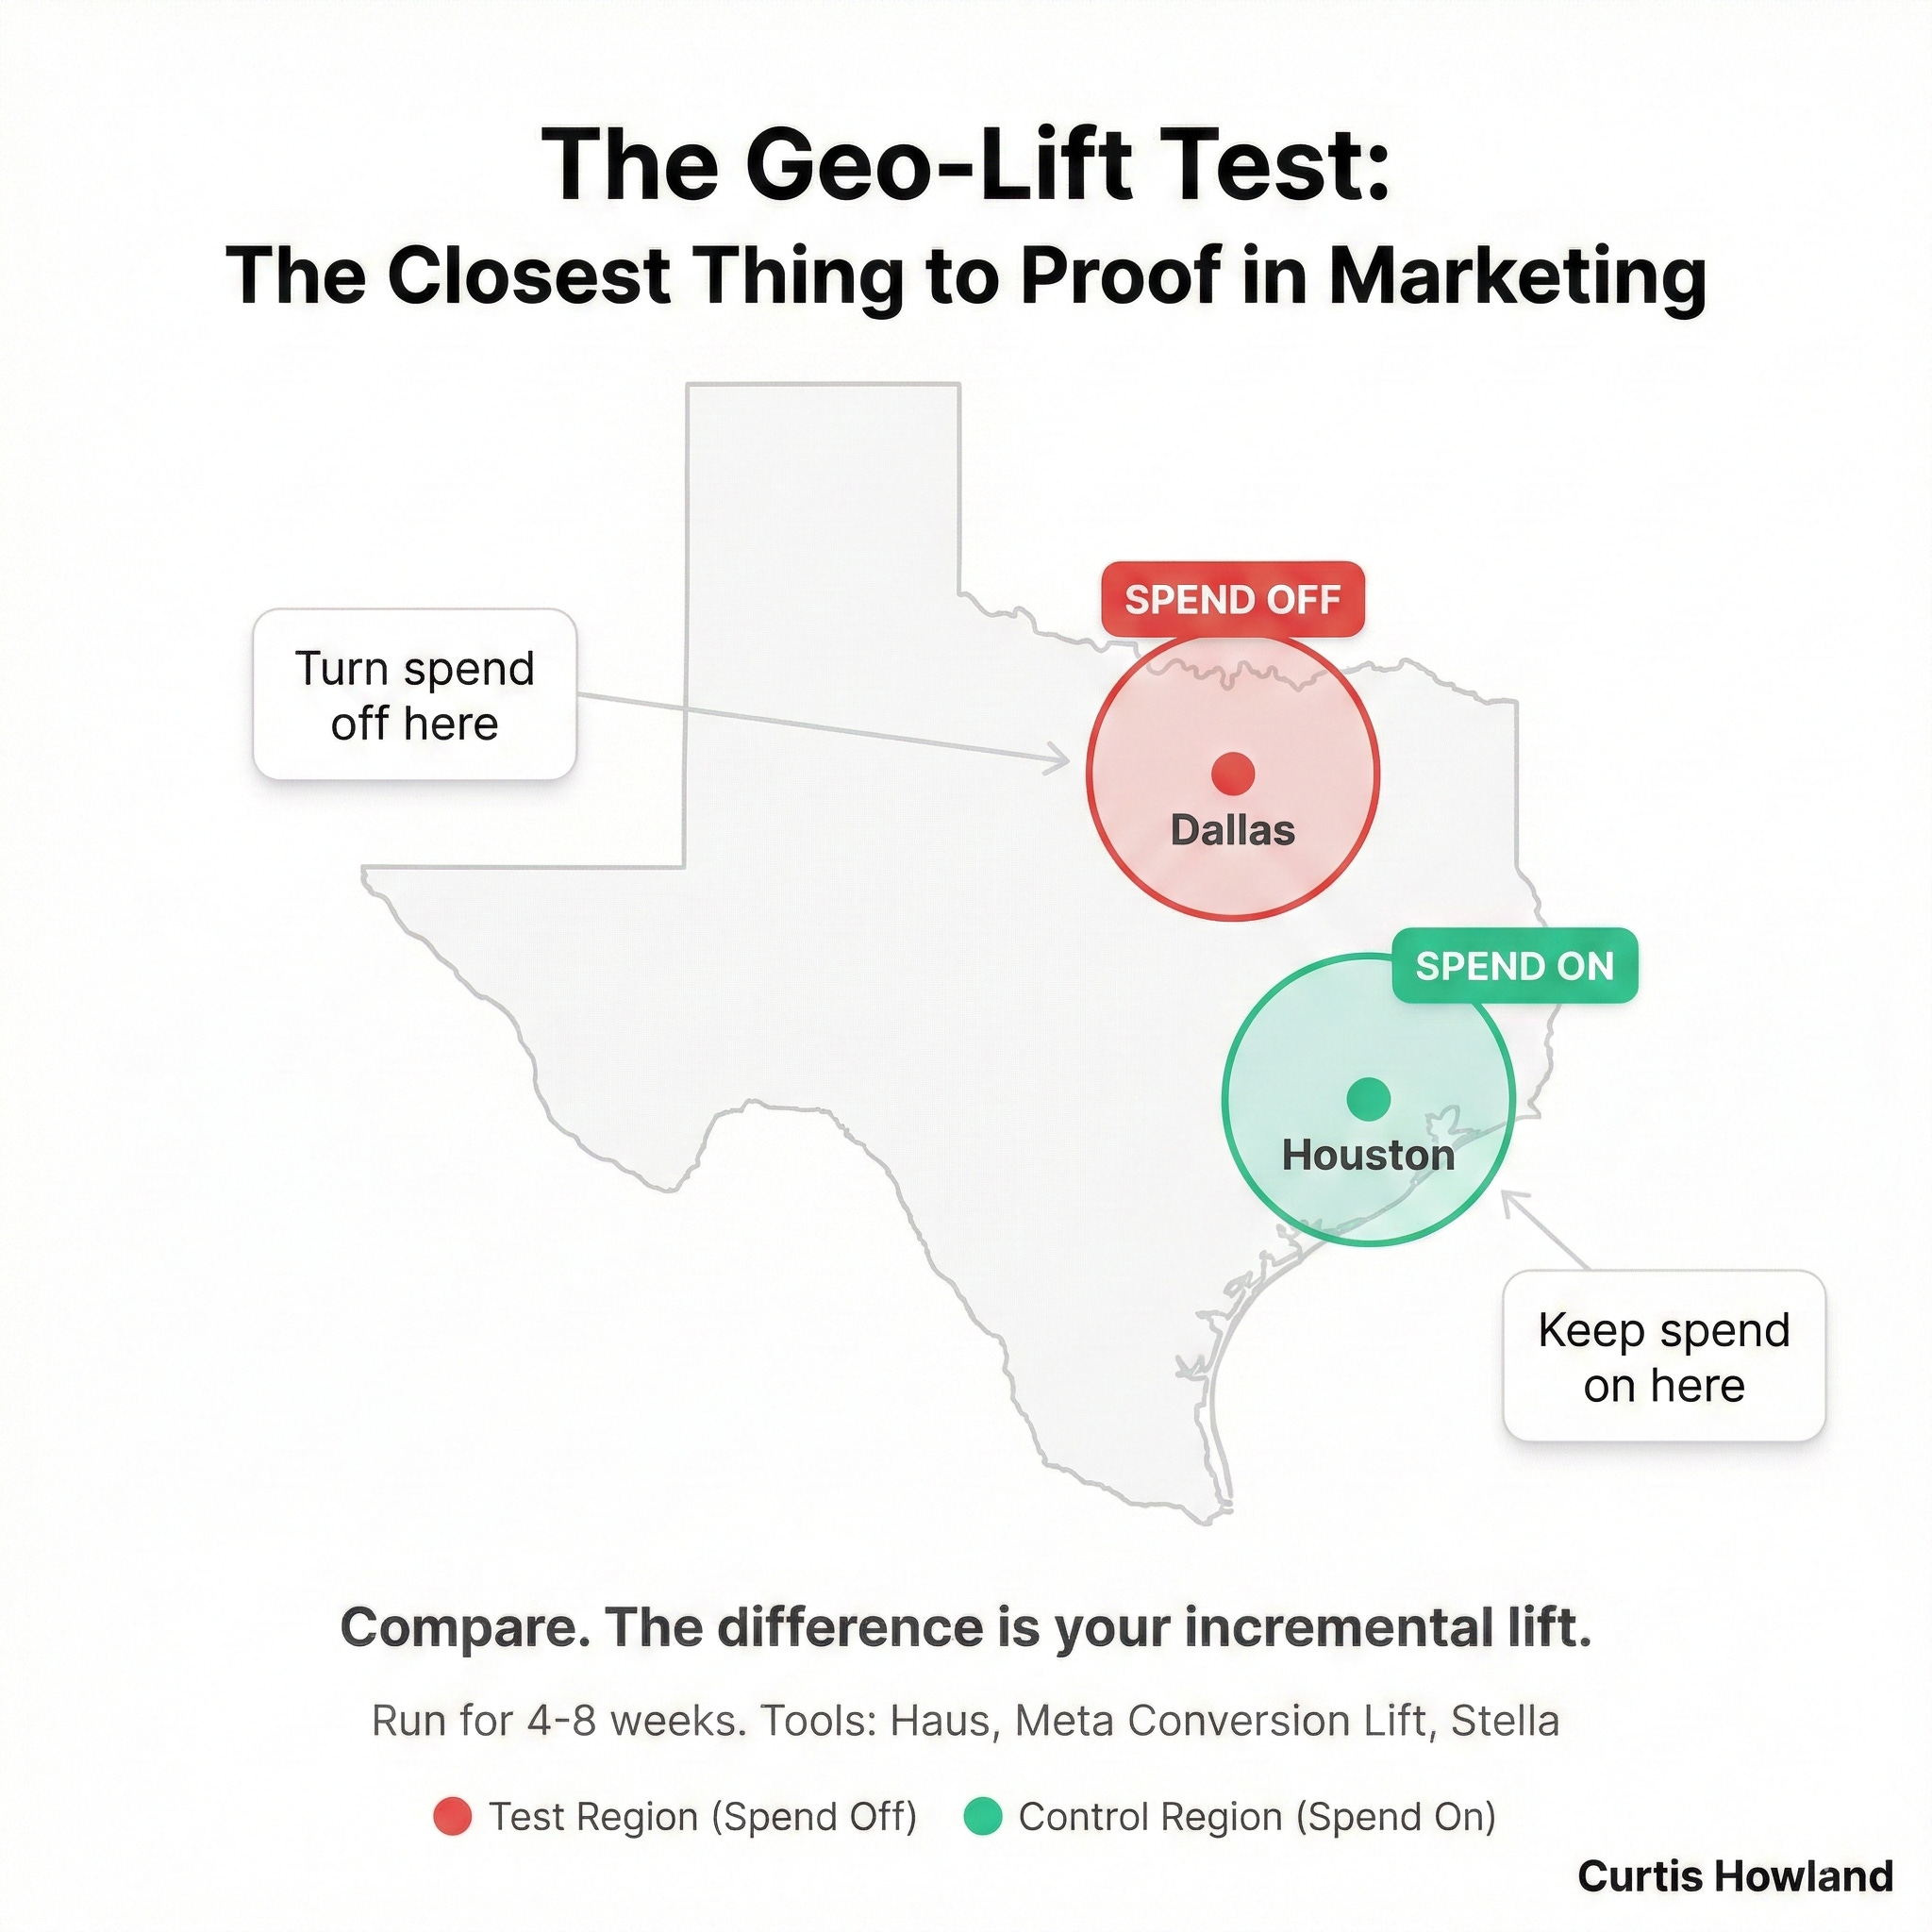
Limitation: Requires planning, budget, and patience. Most tests run 4-8 weeks. You need enough geographic diversity and sales volume for statistical significance. And you can only test one or two things at a time.
It’s also expensive in opportunity cost. You’re deliberately reducing spend in test regions, which means you might leave some revenue on the table during the test period.
But the insight you get is worth it. One well-designed incrementality test can save you from wasting hundreds of thousands on non-incremental spend.
Layer 3: The Lower Branches. Campaign & Ad-Level Optimization
Now we get into the tools most marketers already know. These are powerful for ad-level decisions but dangerous if you use them for channel allocation.
Model 5: Multi-Touch Attribution (MTA)
What it is: Third-party tools (Triple Whale, Northbeam, Rockerbox) that track individual customer journeys across touchpoints and attribute fractional credit to each interaction.
When to use it: Daily, for ad and campaign-level optimization.
Why it’s powerful:
MTA is my primary tool for ad-level decisions. Triple Whale is my go-to, though we use Northbeam as well.
Here’s what makes MTA better than platform-reported data: you can actually see who purchased, where they came from, what they purchased, and validate the attribution yourself. With Facebook’s dashboard, you just have to trust them. With MTA, you can audit it.
I also like MTA because you can look at first-click attribution and understand the full journey. Where did someone originally come from? Did they see multiple ads before converting? Which ad was the first touch versus the last touch?
This matters because the ad that gets the last click isn’t always the ad that deserves the credit. Someone might discover you through a TikTok-style UGC video (first touch), then see a retargeting ad a week later (middle touch), then Google your brand name and click a search ad (last touch). If you only look at last click, you’d think Google Search drove that sale. MTA shows you the full picture.
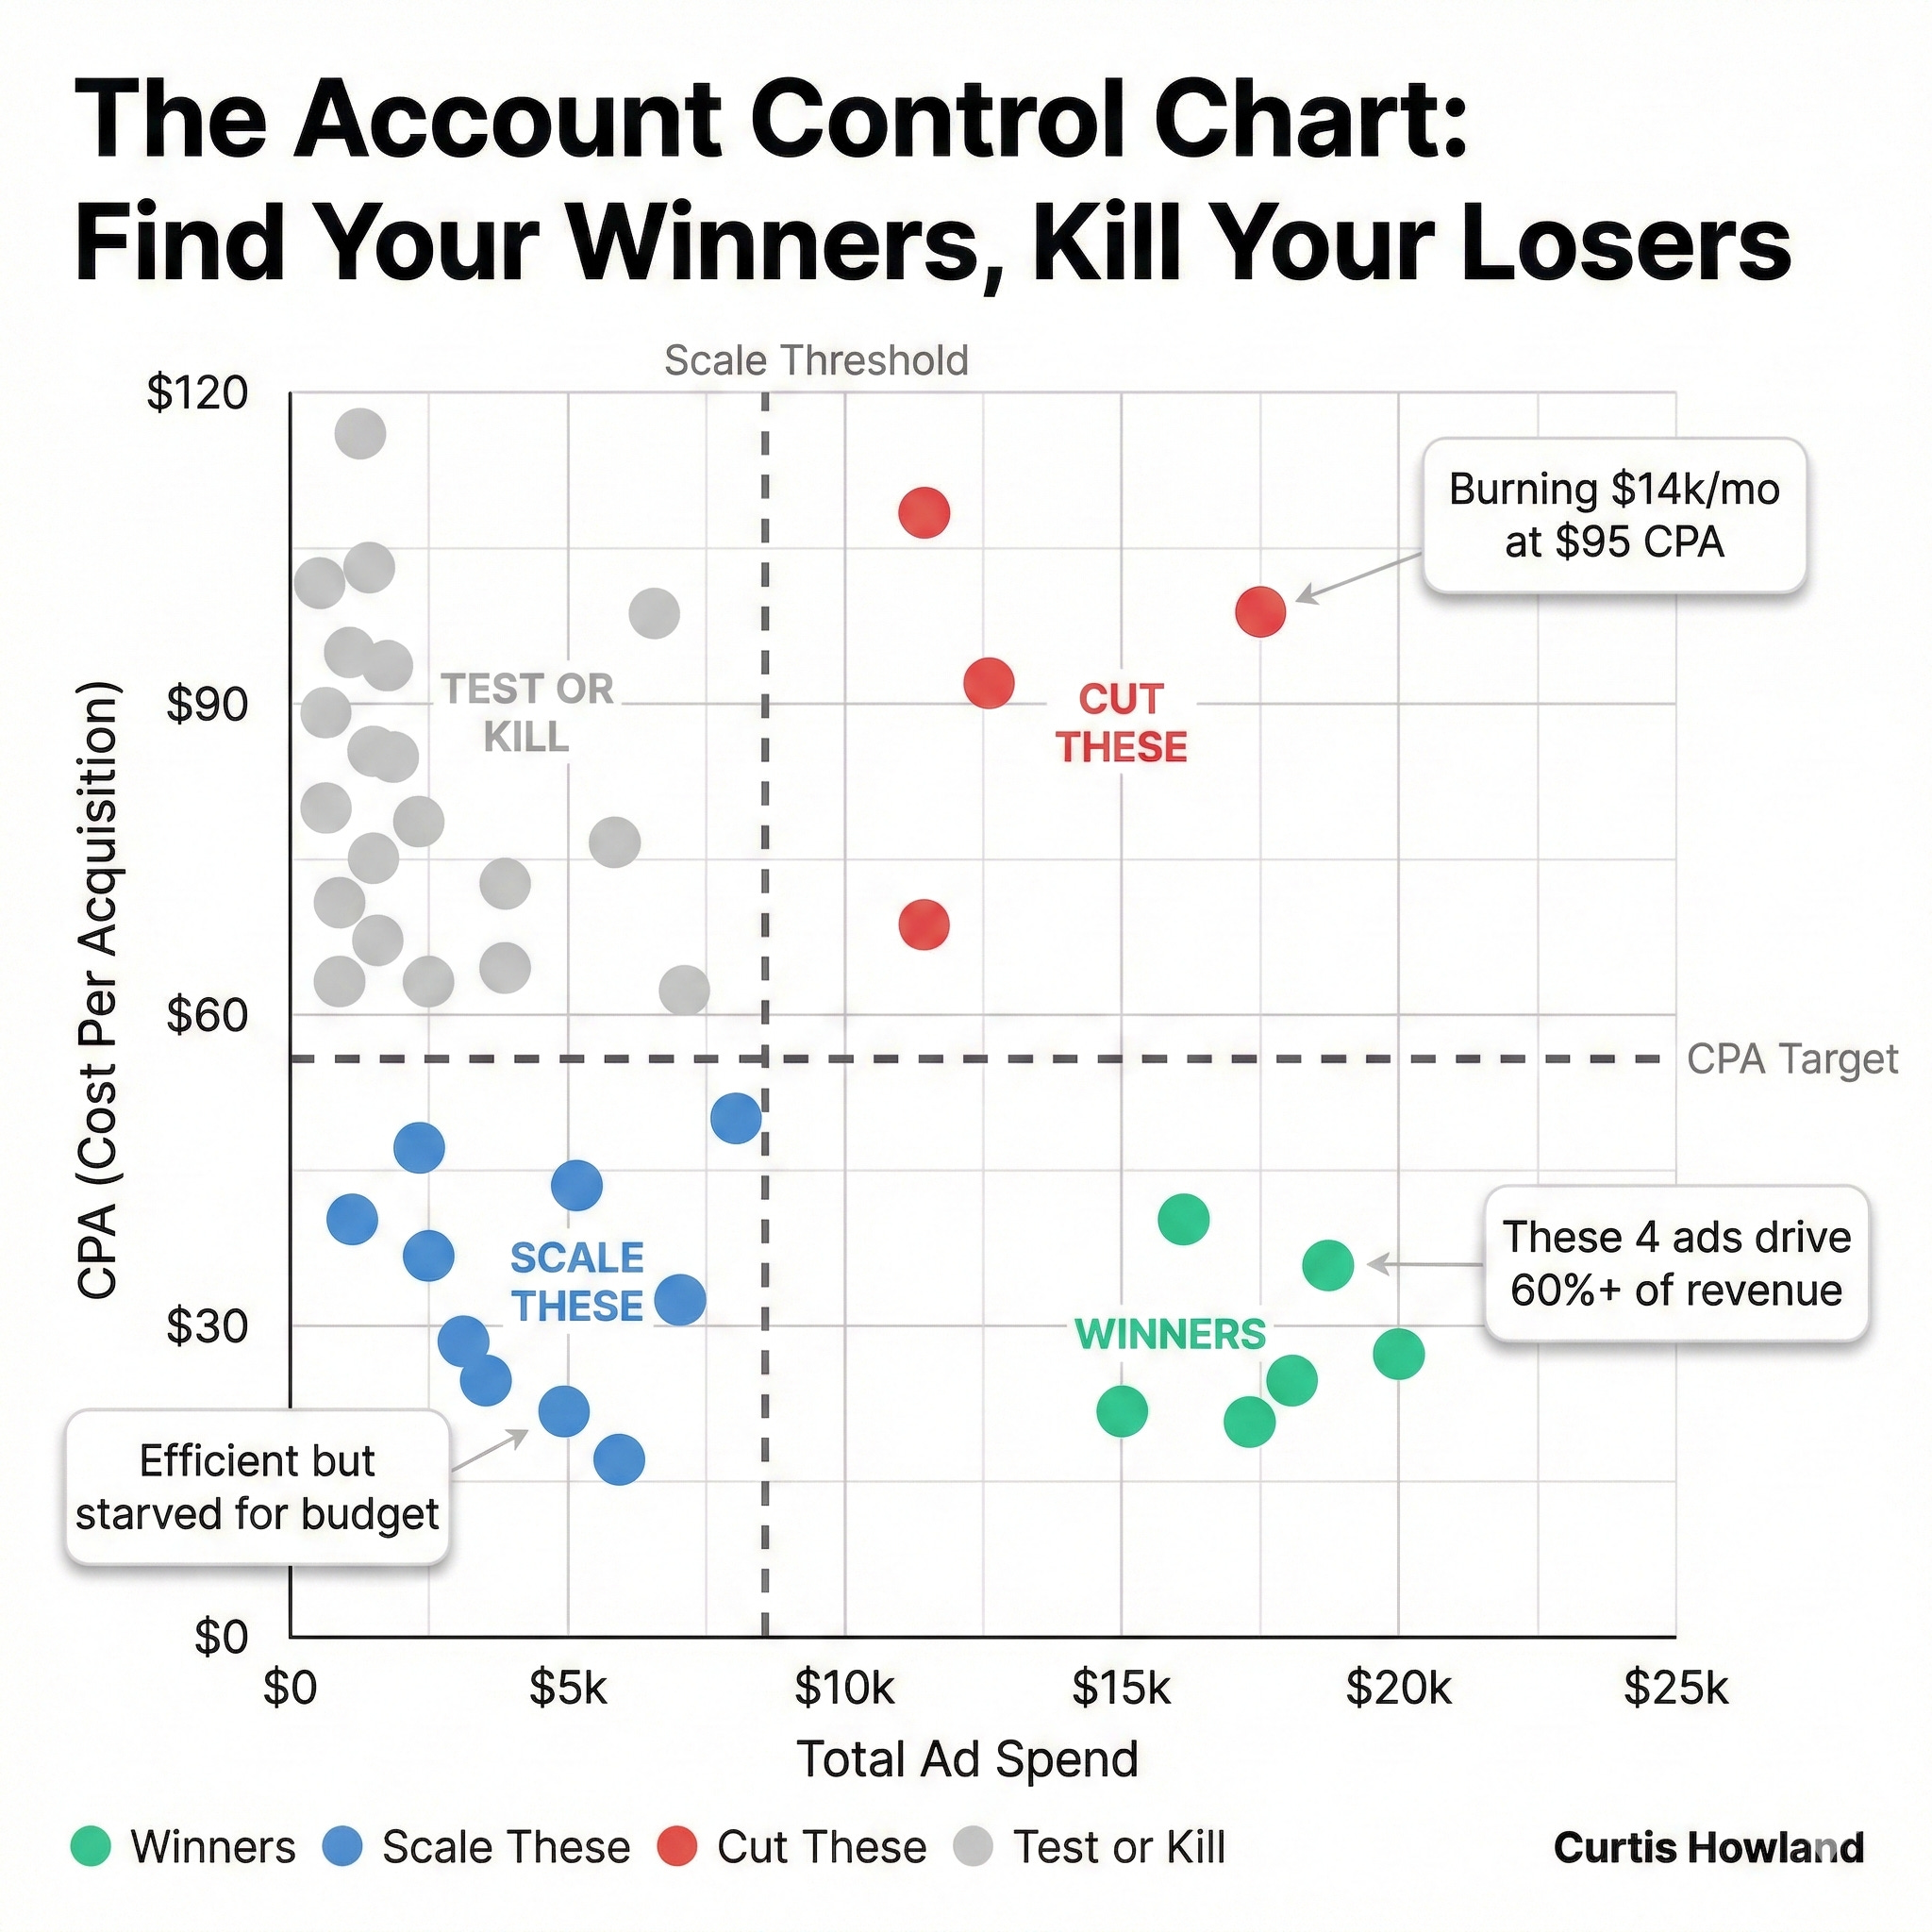
The practical application: this is the data that powers our Account Control Charts. When I plot CPA vs. Total Spend for every ad on a scatter plot, I’m pulling that from MTA. It tells me which ads are efficient but under-scaled, which are burning cash, and which are the winners I need to push harder.
this is the level at which you make individual ad decisions on based on spend and CPA
To make sure your account is well optimized, plot CPA vs. Spend on a scatter plot. Your top ads should be in the low CPA, high spend zone. If they’re not, you have a media buying problem that no amount of new creative will fix.
Limitation: MTA is still fundamentally click-biased. It tracks touchpoints it can see (clicks, website visits), which means it overcounts channels that generate clicks (Google, Meta) and undercounts channels that generate awareness (podcasts, word-of-mouth, TikTok views that don’t result in a click).
It also overcounts total revenue. If you add up all the attributed revenue across channels in Triple Whale, it’ll be higher than your actual revenue. That’s fine. (Or you are relying on them to mix attribution which is dangerous to not be in control). You just can’t compare channel-to-channel directly using MTA. That’s what post-purchase surveys and MMM are for.
Use MTA for ads and campaigns. Not for channel allocation.
Model 6: Platform-Reported Attribution
What it is: The attribution data that Meta, Google, TikTok, and other ad platforms report in their own dashboards.
When to use it: Daily, but with skepticism. Always cross-reference with MTA.
Why it’s useful (with caveats):
I’m not going to tell you to ignore platform data. I use it every day. But I use it for specific things, and I know where it lies.
Here’s what platform attribution is actually good for:
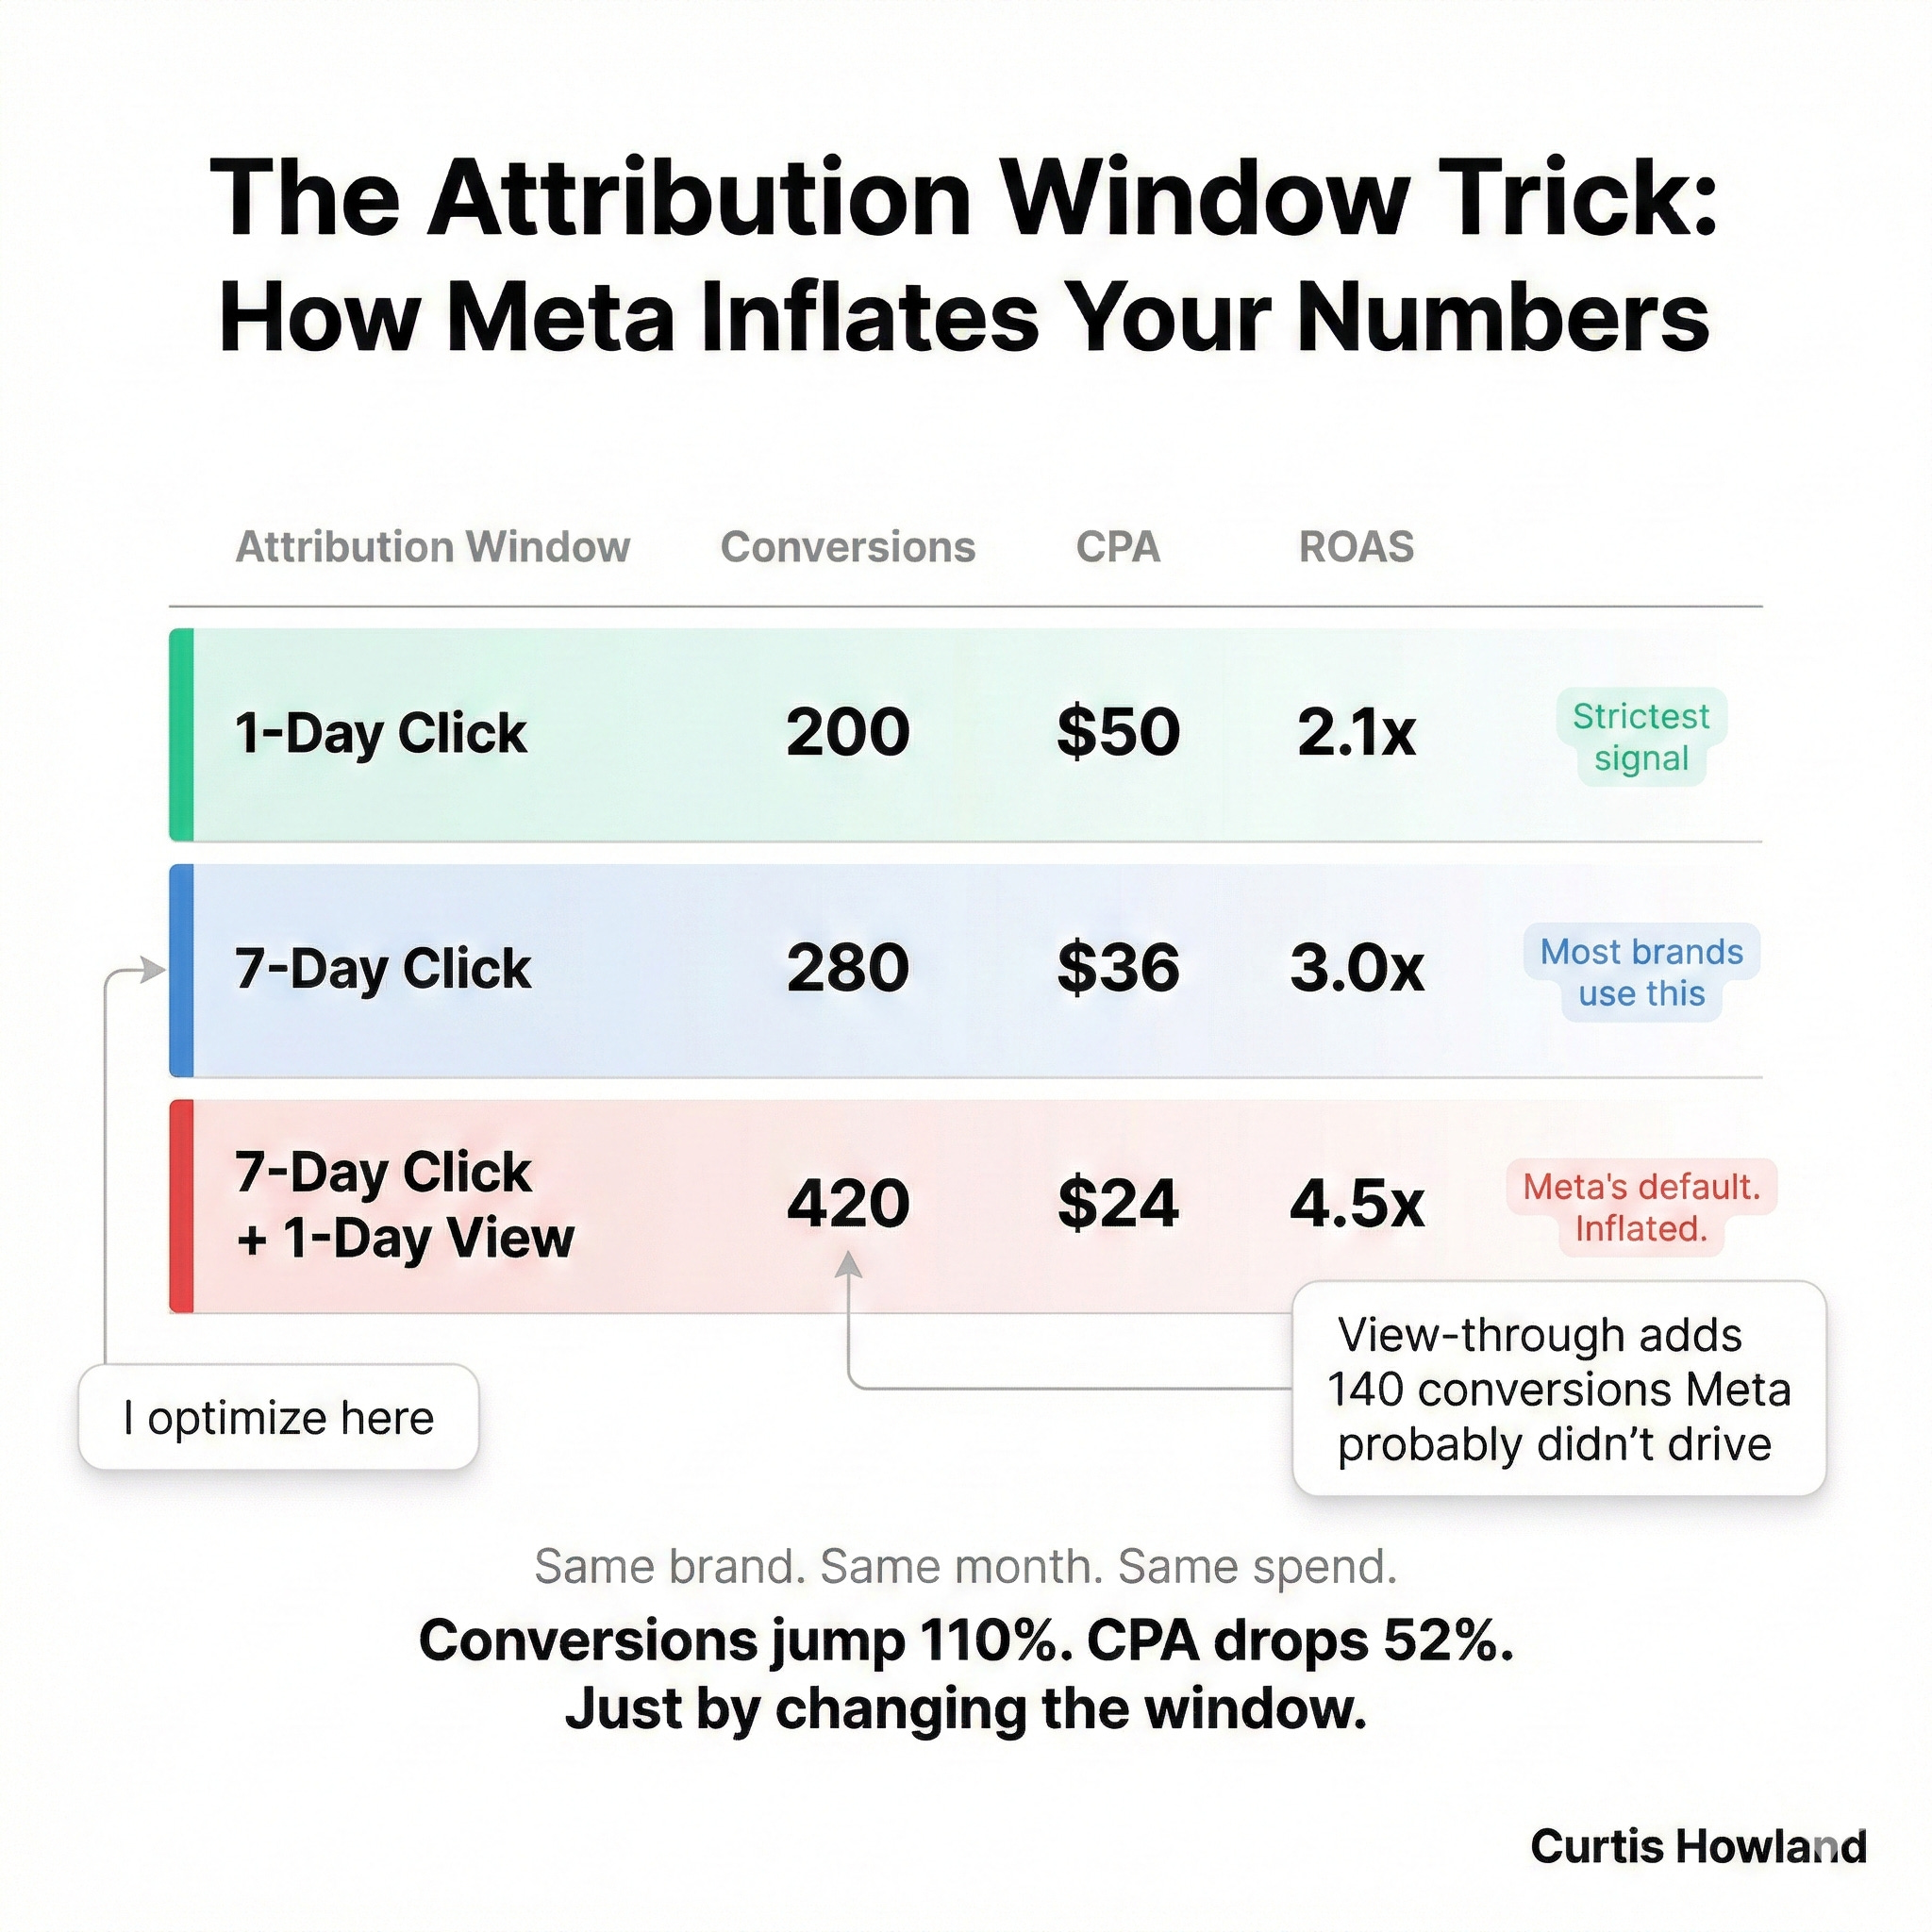
Understanding purchase velocity. I look at 1-day, 7-day, and 28-day attribution windows side by side to understand how quickly customers purchase after seeing an ad. What percentage convert on day 0-1? Day 1-7? Day 7-28? This tells me about the purchase cycle of the product, which informs my scaling strategy and my creative strategy.
If 80% of conversions happen within 24 hours, I’m dealing with an impulse-purchase product and can be more aggressive with scaling. If conversions trickle in over 2-3 weeks, I need more patience and different expectations for new ad launches.
Identifying view-through inflation. I always compare click-based conversions to view-through conversions. View-through is the weakest signal in attribution. A “view-through conversion” means someone was served your ad (maybe for 1 second while scrolling), didn’t click, but later bought something. Meta takes credit.
I try to force Meta to optimize for click-based attribution whenever possible. If a huge percentage of your conversions are view-through, Meta is inflating your numbers. The platform wants you to think your ads are working better than they are so you keep spending.
Limitation: Every platform grades its own homework. Meta will always tell you Meta is working. Google will always tell you Google is working. This is why you never make channel-level budget decisions based on platform reporting alone.
The most dangerous version of this is Google Analytics’ last-click model. GA4 defaults to last-click attribution, which massively favors Google’s own products (Search, Shopping) because they’re almost always the last click before purchase. Of course they are. Someone sees your ad on Meta, gets interested, then Googles your brand name to buy. Google Search gets the credit. But Google didn’t create that demand. Meta did.
You didn’t think Google built a free analytics platform just for fun right? Check their stock price if you think they are a non profit.
This is exactly why I like post-purchase surveys and MMMs. They tell you what created the awareness, not what grabbed the last click. If you optimize for last-click, you’ll over-invest in branded search and discounts. That’s not how you scale a brand.
Layer 4: The Trunk. Supporting Infrastructure
Model 7: GA4 and Server-Side Tracking
What it is: Google Analytics 4 for web analytics, plus server-side tracking tools (Conversions API / CAPI, Elevar, etc.) that send conversion data directly from your server to ad platforms.
When to use it: Always running in the background. This is infrastructure, not a decision-making tool.
Why it matters:
GA4 is biased. I’ll just say it. It’s a Google product that defaults to last-click attribution, so it over-credits Google and under-credits everything else. I don’t use it as an attribution tool.
But server-side tracking is essential. Here’s why:
After iOS 14.5, browser-based tracking (pixels, cookies) lost a huge chunk of signal. Meta’s pixel can’t see a lot of what happens on iPhones. This means your platform-reported data AND your MTA tools are working with incomplete data.
Server-side tracking (CAPI) sends conversion events directly from your server to the ad platforms, bypassing browser restrictions. This doesn’t solve attribution. It makes all your other attribution tools more accurate by feeding them better data.
Tools like Elevar help automate this setup on Shopify. If you’re spending any meaningful amount on paid media and you don’t have server-side tracking set up, your data is leaking. Fix this before you worry about fancy attribution models.
Think of it this way: server-side tracking is the trunk of the tree. It doesn’t bear fruit by itself, but it holds up everything that does.
Limitation: GA4’s attribution model is still biased toward Google. Use it for web analytics (traffic sources, on-site behavior, page performance) but don’t use it as your source of truth for marketing attribution.
The Base: Setting Your Targets
Model 8: Cohort-Based LTV Attribution
What it is: Tracking customer lifetime value by acquisition source and cohort to understand which channels bring the most valuable customers over time. Not just the cheapest first purchase.
When to use it: Monthly review, quarterly deep-dive. This sets your targets, which then flow up through the entire tree.
Why it’s powerful:
All 7 models above assume you have a target. A CPA ceiling, a ROAS floor, an nCAC goal. But should that target change based on quality of traffic?
It should come from LTV by channel.
Here’s a simplified example. You’re acquiring customers from Meta at $40 CPA and from TikTok at $30 CPA. TikTok looks more efficient, right?
But when you pull cohort data:
Meta customers: 35% return rate, 3.2x purchase frequency, $180 12-month LTV
TikTok customers: 20% return rate, 2.1x purchase frequency, $95 12-month LTV
Suddenly Meta customers are worth nearly 2x as much over 12 months. That $40 CPA is a steal. And the $30 TikTok CPA might actually be overpriced relative to the customer quality you’re getting.
This is why I obsess over two LTV metrics above all others: return rate % (percentage of customers who make purchase #2) and purchase frequency (how often returning customers buy). These two drive the majority of LTV variance between channels.
Example scenario:
How this feeds the tree:
Your cohort LTV data tells you what your CPA targets should be by channel or type of ad. That feeds your blended MER/nCAC target at the top of the tree. Which feeds your channel allocation decisions in the middle. Which feeds your ad-level optimization at the bottom.
If you skip this step, you’re optimizing the entire tree toward the wrong target. You’ll efficiently acquire cheap, low-LTV customers. You’ll look great on a dashboard and terrible on the P&L in 12 months.
Why “AI-Powered Attribution” Is Dumb
I’m not going to sugarcoat this one.
In my 2026 hot takes I said “AI-powered attribution tools are guessing.” I stand by that.
The pitch from AI attribution vendors sounds great: “We use machine learning to analyze millions of data points and give you the TRUE value of every touchpoint.”
Here’s why that doesn’t work.
They start with biased data. Every AI attribution model I’ve seen starts with click-based data as its foundation. Clicks, page views, ad impressions, conversion events. This data is already biased. It over-credits platforms that generate clicks and under-credits platforms that generate awareness.
Then they layer complexity on top of the bias. The AI takes biased inputs, runs them through a black-box model, and spits out precise-looking numbers. But precision is not accuracy. You’ve just made a biased answer look more scientific. That’s worse, not better.
You lose understanding. This is the part that bothers me most. Attribution is never going to be perfect. Every model has blind spots. The value of understanding attribution isn’t getting a perfect number. It’s knowing where your model is wrong so you can compensate for it.
When I use post-purchase surveys, I know they over-credit memorable channels and under-credit passive ones. I can adjust for that. When I use MTA, I know it’s click-biased and overcounts revenue. I can adjust for that too. When I use MMM, I know it needs scale to be meaningful and the outputs have wide confidence intervals.
With AI attribution? You get a number. You don’t know how it was calculated. You don’t know where it’s biased. And you can’t adjust for what you don’t understand.
The right approach is top-down, not bottom-up. AI attribution tries to solve the problem from the bottom up: perfectly attribute every individual touchpoint, then roll it up to channel-level insights. But you can’t build accurate channel-level insights from biased touchpoint data, no matter how much AI you layer on.
The approach I’ve outlined here works top-down: start with your blended truth (MER/nCAC), validate at the channel level (surveys + MMM), then use MTA for ad-level decisions. Each layer checks the one below it.
My take: spend your money on a good MTA tool, a well-designed post-purchase survey, and eventually an MMM. Skip the “AI-powered” attribution platforms. They’re solving the wrong problem.
The 3 I Actually Use (and How They Work Together)
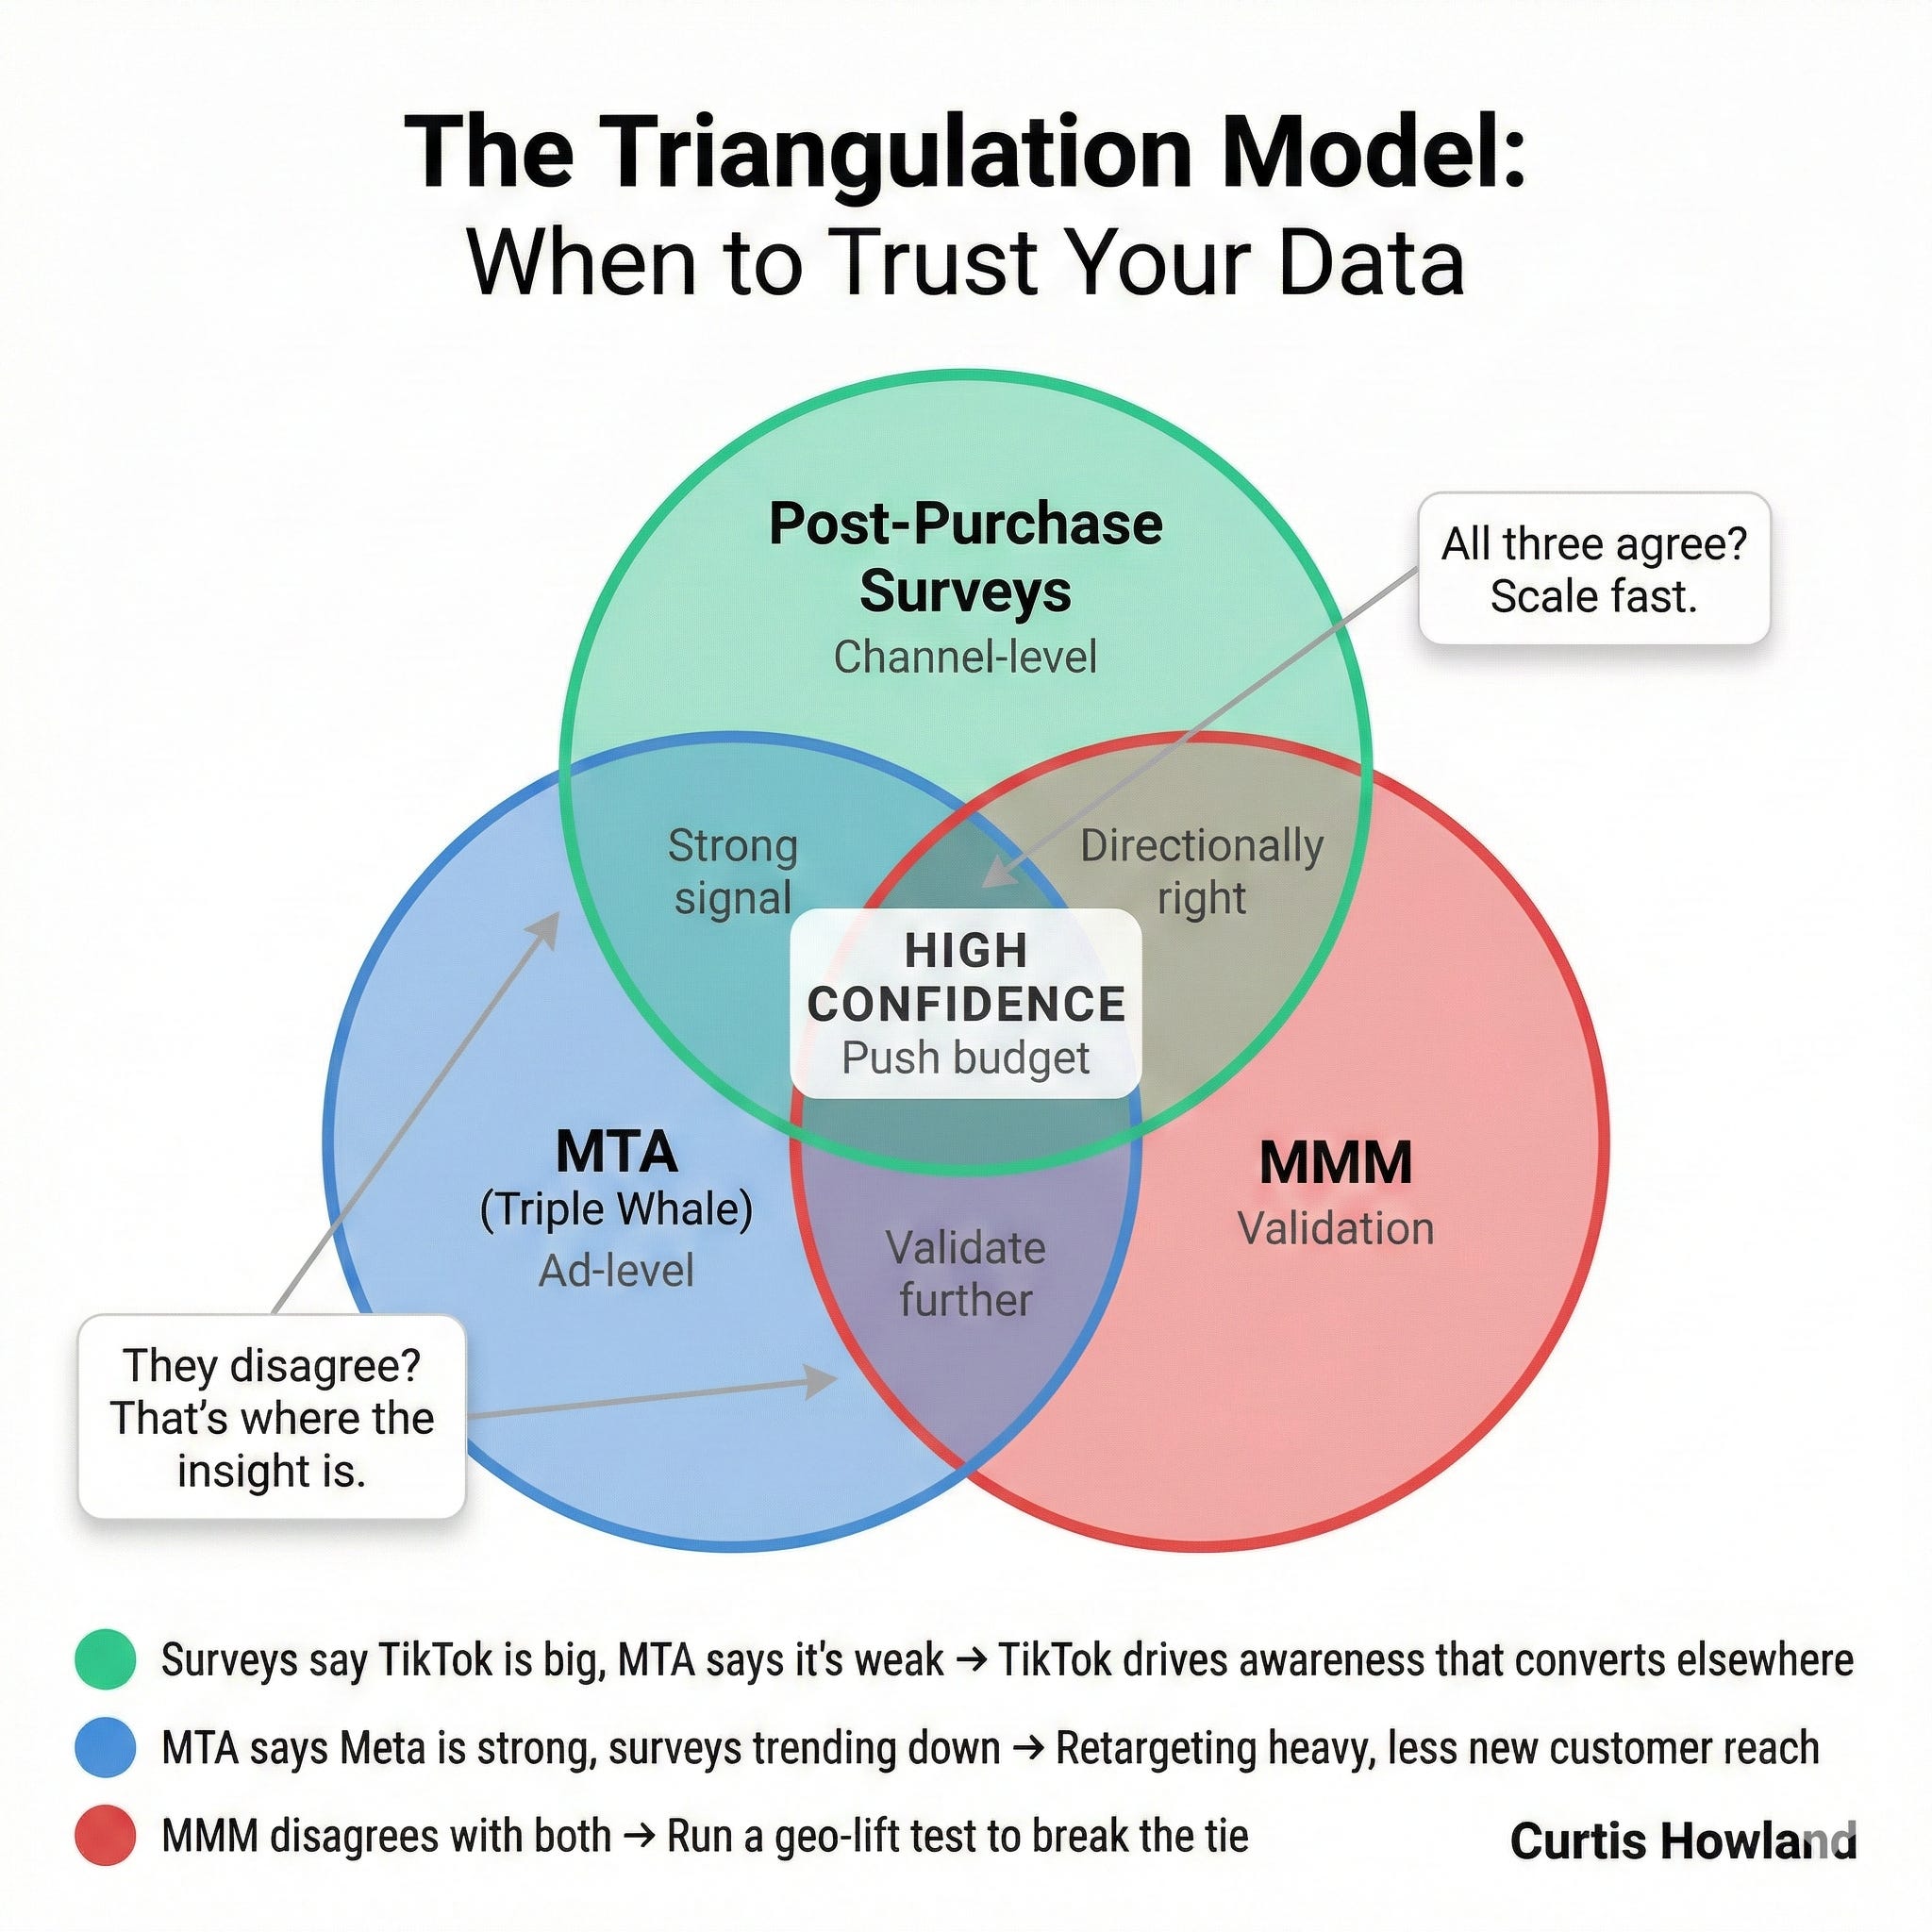
After all that, here are the 3 that make up my daily attribution stack:
1. Multi-Touch Attribution (Triple Whale) for ad and campaign-level optimization. Which ads to scale, which to cut, which to retest. This is where I live daily inside ad accounts.
2. Post-Purchase Surveys for channel-level allocation. Which channels are actually driving awareness and new customer acquisition? This is what I use to decide where to push or pull budget at the channel level. Updated daily.
3. Marketing Mix Modeling for directional validation. Is our post-purchase survey data sending us the right way? Are there channels that surveys miss or over-credit? Reviewed quarterly.
How they triangulate:
When all three agree (MTA shows strong Meta performance, surveys confirm Meta is the top first-touch channel, and MMM validates Meta as the highest-ROI channel) I push budget aggressively.
When they disagree, that’s the interesting part. Let’s say TikTok looks mediocre in MTA (low click-through, average ROAS) but shows up strong in post-purchase surveys (lots of people say “I first heard about you on TikTok”). That tells me TikTok is driving awareness that’s converting through other channels. I wouldn’t cut TikTok based on the MTA data alone.
Or: Meta looks strong in MTA and platform reporting, but post-purchase surveys show a declining share of “first heard about you on Facebook/Instagram” responses month over month. That’s an early warning sign that my Meta ads are becoming more retargeting-heavy and less effective at reaching new people, even though the dashboard numbers still look good.
The three tools catch different lies. That’s the whole point.
Do This Monday
If you take nothing else from this post:
If you’re spending $10k+/month:
Add a post-purchase survey to your checkout (Shopify, KnoCommerce, Fairing, whatever works). “Where did you FIRST hear about us?” Randomize options.
Set up your blended MER and nCAC tracking in a simple spreadsheet. Know your maximum and target spend.
Switch Meta to 7-day click attribution if you haven’t. Stop relying on view-through.
If you’re spending $50k+/month:
4. Install Triple Whale or Northbeam. Start tracking new vs. returning customer ROAS by ad.
5. Build your Account Control Chart (CPA vs. Spend scatter plot from MTA data). Know which ads are winning and whether they’re actually getting scaled.
6. Make sure server-side tracking (CAPI / Elevar) is set up and firing correctly.
If you’re spending $250k+/month:
7. Start pulling cohort LTV data by acquisition channel. Adjust your CPA targets by channel accordingly.
8. Consider MMM (Robyn if you have data science resources, or a SaaS platform like Measured or Sellforte).
9. Run your first incrementality test (Haus or Meta’s Conversion Lift Study). Start with your biggest spend channel and ask: “How much of this is actually incremental?”
None of these are optional if you want to scale profitably.
Attribution isn’t about finding the perfect model. There is no perfect model. It’s about building a system of imperfect models that check each other.
Start at the top of the tree. Work your way down. Never trust a single source of data.
If this was useful, send it to your team or share on LinkedIn and tag me!
Best compliment you can give!